I started looking at network-monitoring tools because my home network has become more crowded than I realized.This isn't just one desktop plugged into a router anymore.I have multiple Roku TVs, an Xbox, an Alexa speaker, a Fire TV Stick, several iPads and phones, and around four PCs online at any given time.
I also have a Mac I use for music production that can download updates and content in the background.Add in music gear like my Kemper Player, and there are a lot of things in the house that may have a reason to be using my internet connection.That doesn't automatically mean anything shady is happening.
Most of it is probably normal: updates, sync services, app checks, streaming devices refreshing content, and background services doing what they were designed to do.But that's also why I wanted a better look.When so many devices and apps are connected, "something is using the internet" is not a useful answer.
That's what sent me looking for a network-monitoring tool in the first place, but I didn't just want another dashboard full of activity graphs.I wanted something I could actually understand without becoming a network engineer, and I wanted more than a passive list of connections.If an app or device was talking to the internet, I wanted to know what was making the connection, where it was going, and whether I had any control over it.
Wireshark showed me everything, but it was too much Powerful packet capture is not the same as an easy answer Wireshark was the first tool I tried because it has a great reputation, and it did exactly what I expected it to do.It showed me network traffic in incredible detail.I could see packets, protocols, addresses, ports, timing, and more low-level information than I could reasonably process.
That is the strength of Wireshark, but it was also the problem for me.I wasn't trying to become a network analyst.I just wanted to understand what was using my internet connection and whether anything deserved a closer look.
Wireshark gave me all of the raw data, but turning that data into a simple answer took more effort than I wanted to spend.If you already know how to read packet captures, it is an excellent tool.But if you are looking for an easy, app-friendly way to see what is talking to the internet, you may end up in the same boat I did: impressed by how much Wireshark can show you, but overwhelmed by how much work it takes to make sense of it.
Quiz 8 Questions · Test Your Knowledge Network monitoring fundamentalsTrivia challenge From packet sniffers to SNMP traps — find out how much you really know about keeping networks healthy. ProtocolsToolsSecurityConceptsPerformance Begin 01 / 8 Protocols Which protocol is most commonly used by network monitoring tools to collect device statistics like CPU load, bandwidth usage, and interface status? AICMPBSNMPCSMTPDDHCP Correct! SNMP (Simple Network Management Protocol) is the backbone of network monitoring.It allows management systems to poll devices and receive traps — unsolicited alerts — when something goes wrong. Not quite.The correct answer is SNMP (Simple Network Management Protocol).
While ICMP is used for basic ping tests, SNMP is the industry-standard protocol for collecting detailed device metrics and receiving event notifications. Continue 02 / 8 Tools What does the popular open-source tool Wireshark primarily do? AMaps network topology automaticallyBMonitors server uptime and sends alertsCCaptures and analyzes network packet data in real timeDScans for open ports across a subnet Correct! Wireshark is a packet analyzer that captures live traffic and lets you inspect individual frames in detail.It supports hundreds of protocols and is an essential tool for troubleshooting and security analysis. Not quite.Wireshark is a packet capture and analysis tool.
It lets network engineers dissect traffic at the frame level, making it invaluable for diagnosing connectivity issues, spotting malicious traffic, and understanding protocol behavior. Continue 03 / 8 Concepts In network monitoring, what does the term 'baseline' refer to? AThe minimum bandwidth guaranteed by an ISPBA snapshot of normal network behavior used as a reference for detecting anomaliesCThe lowest firmware version supported by a managed switchDThe default VLAN assigned to untagged traffic Correct! Establishing a baseline means recording what 'normal' looks like — typical traffic volumes, latency ranges, error rates, and more.When metrics deviate significantly from the baseline, it signals a potential problem worth investigating. Not quite.A baseline is a recorded profile of normal network behavior over time.
Without one, it is very difficult to distinguish a genuine performance problem from ordinary fluctuations in traffic patterns. Continue 04 / 8 Performance Which metric measures the delay between a data packet being sent and its arrival at the destination? AJitterBThroughputCLatencyDPacket loss Correct! Latency is the end-to-end travel time of a packet, typically measured in milliseconds.High latency is especially problematic for real-time applications like VoIP and video conferencing, where delays are immediately noticeable. Not quite.The answer is latency.
Jitter refers to the variation in latency over time, throughput is the actual data transfer rate, and packet loss is the percentage of packets that never reach their destination — all important but distinct metrics. Continue 05 / 8 Protocols What is the purpose of ICMP in network monitoring? AEncrypting management traffic between devicesBAssigning IP addresses dynamically to hostsCSending error messages and performing connectivity tests like pingDSynchronizing time across network devices Correct! ICMP (Internet Control Message Protocol) is used for diagnostics and error reporting.The familiar 'ping' command relies on ICMP echo requests and replies to test whether a host is reachable and measure round-trip time. Not quite.ICMP handles error reporting and connectivity testing.
Time synchronization is handled by NTP, IP address assignment is done by DHCP, and management traffic encryption is typically handled by SSH or TLS — not ICMP. Continue 06 / 8 Security Which type of monitoring focuses specifically on detecting unusual or malicious traffic patterns within a network? ABandwidth monitoringBNetwork traffic analysis (NTA)CConfiguration managementDUptime monitoring Correct! Network traffic analysis examines flows and packet data to identify anomalies that could indicate intrusions, malware, or data exfiltration.Tools in this category often use behavioral baselines and machine learning to flag suspicious activity. Not quite.Network traffic analysis (NTA) is the discipline focused on identifying malicious or abnormal behavior in traffic patterns.
Bandwidth monitoring tracks utilization, uptime monitoring checks availability, and configuration management audits device settings — all useful, but not security-focused by nature. Continue 07 / 8 Tools What does the acronym 'SNMP trap' describe in a network monitoring context? AA firewall rule that blocks unauthorized SNMP queriesBAn unsolicited alert sent from a monitored device to a management system when an event occursCA scheduled poll sent by a monitoring server to check device healthDA method of encrypting SNMP community strings Correct! Unlike SNMP polling where the manager asks the device for data, a trap is pushed by the device itself when a specific condition is met — such as a link going down or a temperature threshold being exceeded.This enables faster alerting without constant polling. Not quite.An SNMP trap is a proactive, unsolicited message sent by a device to notify the monitoring system of an event.
This is the opposite of polling, where the monitoring server initiates the data request on a schedule. Continue 08 / 8 Concepts What does 'NetFlow' technology allow network administrators to do? ARemotely reboot network switches and routersBAutomatically assign VLANs based on device typeCCollect and analyze metadata about IP traffic flows passing through a deviceDPush firmware updates to managed network devices Correct! Originally developed by Cisco, NetFlow collects metadata about traffic flows — including source, destination, port numbers, and byte counts — without capturing the full packet payload.It gives administrators visibility into who is talking to whom and how much bandwidth is being consumed. Not quite.NetFlow is a traffic flow telemetry protocol that records metadata about IP conversations traversing a router or switch.
It is widely used for bandwidth analysis, capacity planning, and detecting unusual traffic patterns without the overhead of full packet capture. See My Score Challenge Complete Your Score / 8 Thanks for playing! Try Again The other issue was control.Wireshark showed me what was happening, but it didn't give me a simple way to do anything about it.That's not a knock against Wireshark.
It's just not what the tool is built for.I wanted more than a window into my network traffic.I wanted something that could help me decide what should be allowed to keep talking to the internet.
GlassWire made the activity much easier to understand A cleaner view still wasn't the same as simple control GlassWire was a much better fit for what I was trying to do at first.Instead of throwing me into a wall of packet data, it gave me a visual timeline that made the activity easier to grasp.I could see when my connection got busy, which apps were involved, and how much data they were using.
The app-based breakdown was especially helpful because it moved the question from "what are all these packets?" to "which program is actually doing this?" Related How to See All Devices on Your Network With nmap on Linux It isn't as intuitive as a user interface, but it is more powerful.Posts 2 By Dave McKay That was a big improvement over Wireshark, but it still wasn't quite what I was looking for.GlassWire does have blocking abilities, so this isn't a case where it only shows you traffic and stops there.
For me, though, it still felt more like a monitoring tool first.I wanted something where control felt more central.I wanted a tool that made it simple to decide which apps should be allowed to keep talking to the internet and which ones needed a closer look.
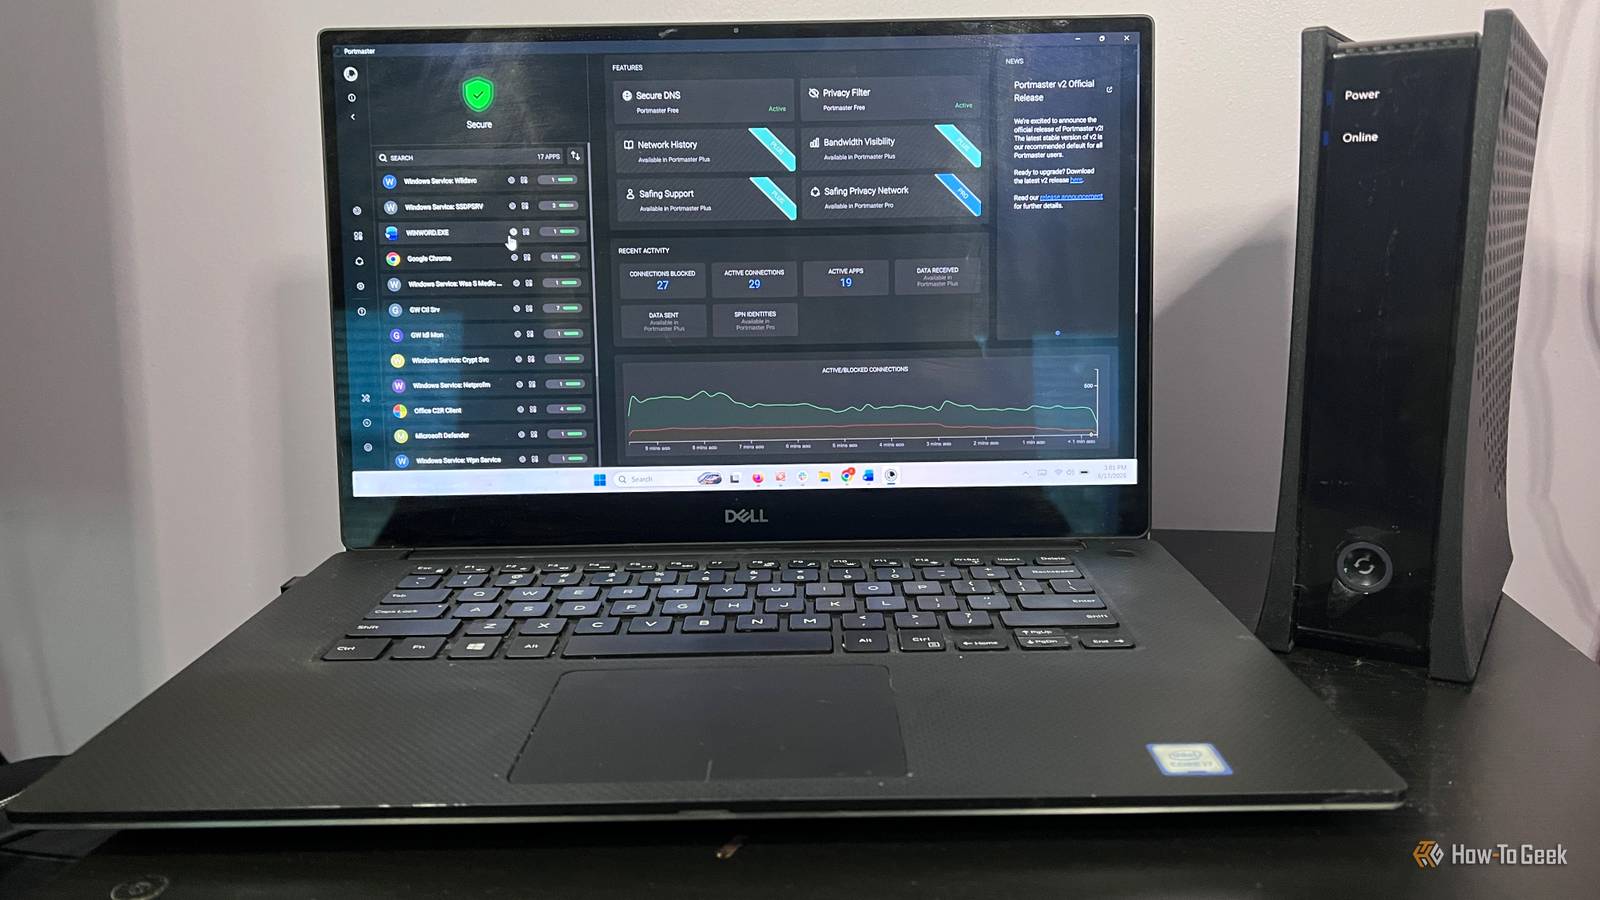
Portmaster didn't just show connections, it let me control them The cool part was getting from "what is this?" to "should I allow it?" Portmaster was the tool that felt closest to what I was looking for.It still showed me which apps were reaching out to the internet, but the difference was what I could do next.I could look at an individual app, see the destinations it was connecting to, and start making decisions instead of just staring at activity.
That app-based approach made the whole process feel more practical.I wasn't just asking, "what is this connection?" I was asking, "does this app need to be allowed to make it?" The per-app rules are what made Portmaster stand out for me.Instead of treating network activity as one big stream of traffic, it let me think about it app by app.
Not every app needs the same level of access.Portmaster made it easier to block or allow connections based on the app and destination, which is the kind of control I was looking for from the start.That said, Portmaster is not necessarily the easiest option for everyone.
It asks you to be more involved, and that can be a good or bad thing depending on what you want.Blocking connections randomly is also a great way to break things, especially with apps that rely on background services, authentication, updates, or cloud sync.For me, that tradeoff was worth it because I wanted control, not just visibility.
But if all you want is a simple graph of what used data today, GlassWire is probably the easier place to start.Eero Pro 7 Wi-Fi Router Amazon's Eero Pro 7 router offers high-speed Wi-Fi 7 connectivity with up to 1.8 Gb wireless throughput, supports 5 Gb internet, tri-mesh, and has a 2,000-square-foot range. Buy on Amazon Expand Collapse Portmaster is the one I'm leaving installed Wireshark was the most powerful tool I tried, and GlassWire made network activity much easier to understand, but Portmaster was the one that best matched what I was looking for.I didn't just want to see that apps were using my connection.
I wanted a practical way to look at those connections, understand where they were going, and decide what should be allowed.Portmaster is more hands-on than the others, and that won't be the right fit for everyone, but for me, that extra control is exactly why it’s the network-monitoring tool I'm keeping.
Read More