
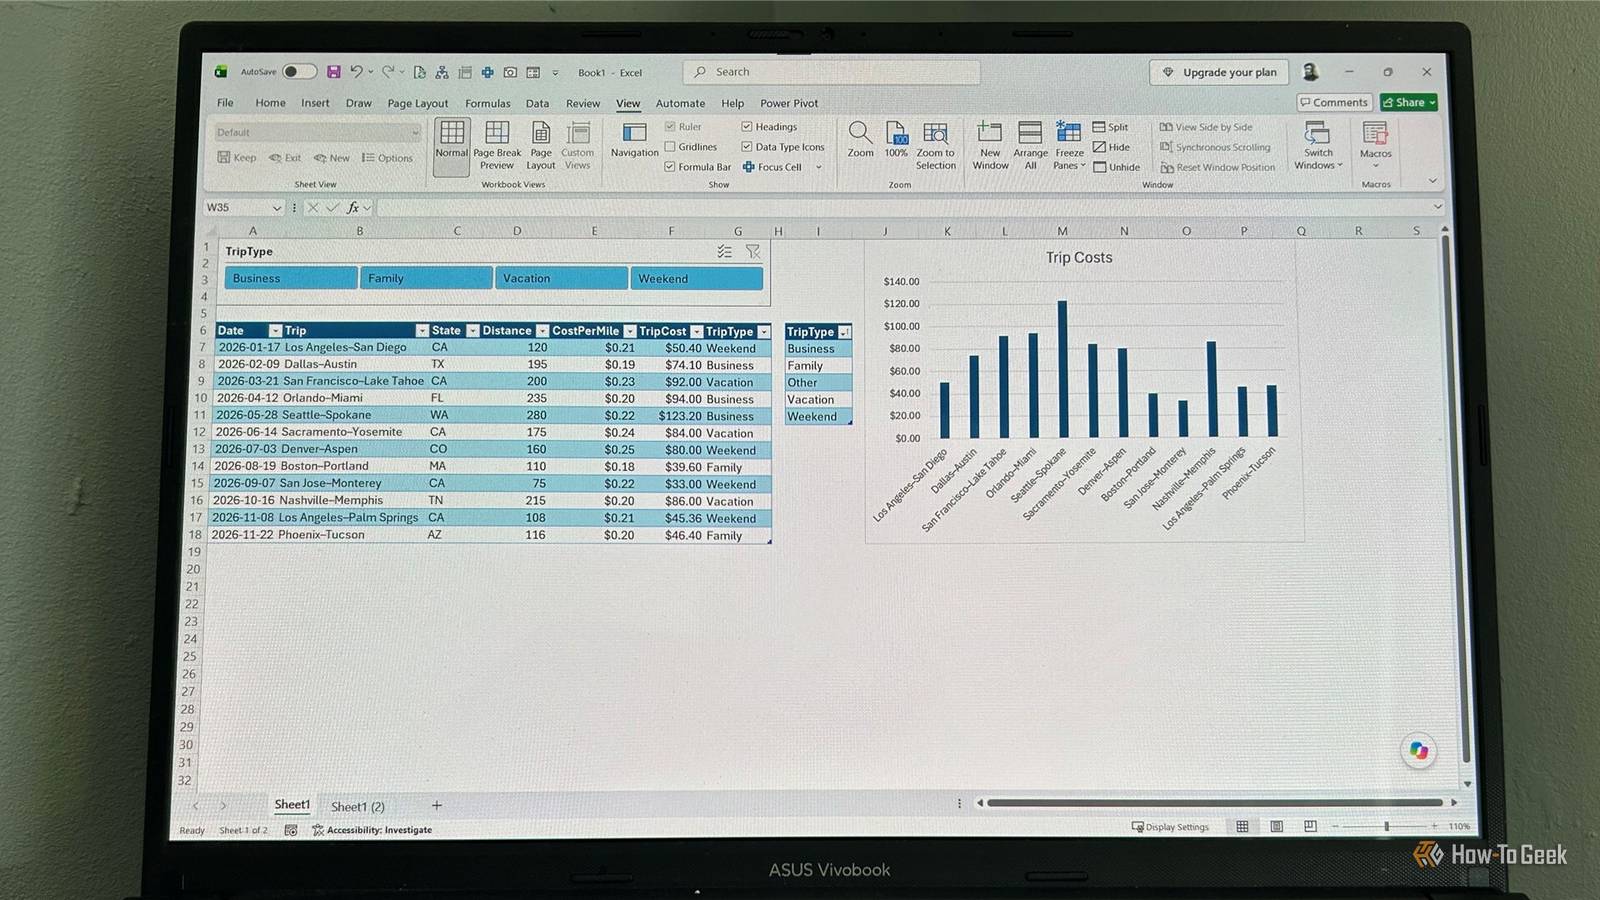
Excel tables don't exactly sound exciting.You select some data, press Ctrl+T, and Excel gives you a nicely formatted block with distinct headers and banded rows.Very professional; very Excel.
If that's all you think tables are for, I wouldn't blame you.I've been using Excel for decades, and even I sometimes take tables for granted.But the real benefit is what happens next.
Create a single structure that expands as you add more data Give your data room to grow Tables take much of the routine Excel work off your hands.Start typing a new record directly below your table, and Excel grabs it and pulls it into the table.You don't need to resize the table yourself, and things such as conditional formatting and data validation applied to the existing table carry down automatically.
The same thing happens with columns.Type a new header in the column immediately to the right of your table, and Excel adds the new column to the table.If you want to put something else immediately below or beside your table, leave a blank row or column between it and the table.
Otherwise, Excel may assume you're trying to expand the table.Turn messy references into readable addresses Make your formulas explain themselves Close One of the nicest things about tables is that they replace cryptic cell addresses with structured references that tell you what the data actually represents.The easiest way to create them is to click the cells while building your formula.
For example, type =, click the first Distance cell, type *, then click the first CostPerMile cell.Excel gives you: =[@Distance]*[@CostPerMile] The @ means "this row," so the formula always uses the values from the current record.Structured references work outside the table, too.
For example, if your table is named tblTrips, this formula sums the entire Distance column: =SUM(tblTrips[Distance]) You can also use them with dynamic array functions, such as: =FILTER(tblTrips,tblTrips[State]=J1) Notice how Excel adds the table name when you reference a column from outside the table.There's one slight annoyance: Excel doesn't automatically convert existing cell references into structured references when you turn a range into a table, so it's worth creating your table before adding formulas.Make formulas consistent Enter it once and move on Close Tables can also save you from one of the more tedious parts of working with formulas: making sure every row has the right one.
Enter a formula in one cell of a table column, and Excel fills the rest of the column automatically.If you add more rows later, the formula comes along for the ride, too.For example, if your table has Distance and CostPerMile columns, enter your trip-cost formula once, and Excel creates a calculated column containing the same formula for every record.
If you change the formula later, Excel updates the entire calculated column.That means fewer formulas to drag, copy, or check for missing rows.It's a small thing, but when you're working with hundreds or thousands of records, letting Excel handle that repetitive work can save a lot of time.
See useful totals without writing another formula Let the table keep score Close If you need a quick summary of your data, your table can calculate it for you.Turn on Total Row in the Table Design tab, then use the drop-down menu in each column to choose what you want to see.For example, one column can show a sum, another an average, and another a count.
There's another useful trick here: by default, Total Row calculations respond to filters.If you filter your table to show only California trips, for example, the Total Row can show the total for those visible records rather than the entire dataset.Remove the filter, and the total updates again.
If you regularly filter your data, keep an overall total somewhere else on the sheet.A formula such as =SUM(tblTrips[Distance]) will continue to include the entire table, giving you an easy way to compare the filtered total with the overall figure.Unlock a different way to filter Give your filters some buttons If you find yourself repeatedly clicking the tiny filter arrows to narrow down a table, slicers give you a much more visible way to do it.
Select your table, go to Table Design > Insert Slicer, and choose the columns you want to filter by.Excel creates a set of buttons for each selected column.Click one to filter the table, and the slicer makes it obvious which filter is active.
You can also select multiple items, clear a filter with a button, and use several slicers together.I particularly like using slicers when I'm building a dashboard or sharing a worksheet with someone else, because the available choices are always sitting there in plain sight.Create automatically updating drop-down lists Keep your choices in the table Close Data validation lets you control what can be entered into an Excel cell.
One of its most useful features is the drop-down list, which lets you or someone else choose a value from a predefined set of options.You can type those options directly into the Data Validation dialog, but you can also select a range of cells that already contains them.The problem is that a regular range doesn't automatically expand when you add another option.
Turn that range into a table, though, and the list expands automatically when you add another option to the table.There's a small catch: the dialog doesn't accept a structured reference such as =tblTripTypes[TripType] directly in the Source field.However, if the table and drop-down list are on the same worksheet, you can select the table column (excluding the header) when setting up the validation, and Excel will keep the source range in step with the table as it grows.
If the table and drop-down list are on different worksheets, select the table column (excluding the header), type a name (such as TripTypes) into the Name Box, and press Enter.Then, enter that named range in the Data Validation dialog's Source box (=TripTypes).From then on, the drop-down list will automatically update as you add items to the table.
Feed other Excel features with expanding data Give your workbook a better foundation A table can also make other parts of your workbook easier to manage because it gives them a source that expands as your data grows.For example, if you create a chart from a table and add another record, the chart automatically includes it without you having to adjust its source range.The same idea works with PivotTables and Power Query.
When you use a table as the source, adding more records means the next refresh picks them up automatically.Tables are only as good as the data behind them Excel tables won't magically fix a poorly structured spreadsheet.Before you create one, make sure your data is properly laid out, with no blank rows or columns breaking it up and a clear header for each column.
Get those basics right, and Excel has the structure it needs to work with your data.
Read More