
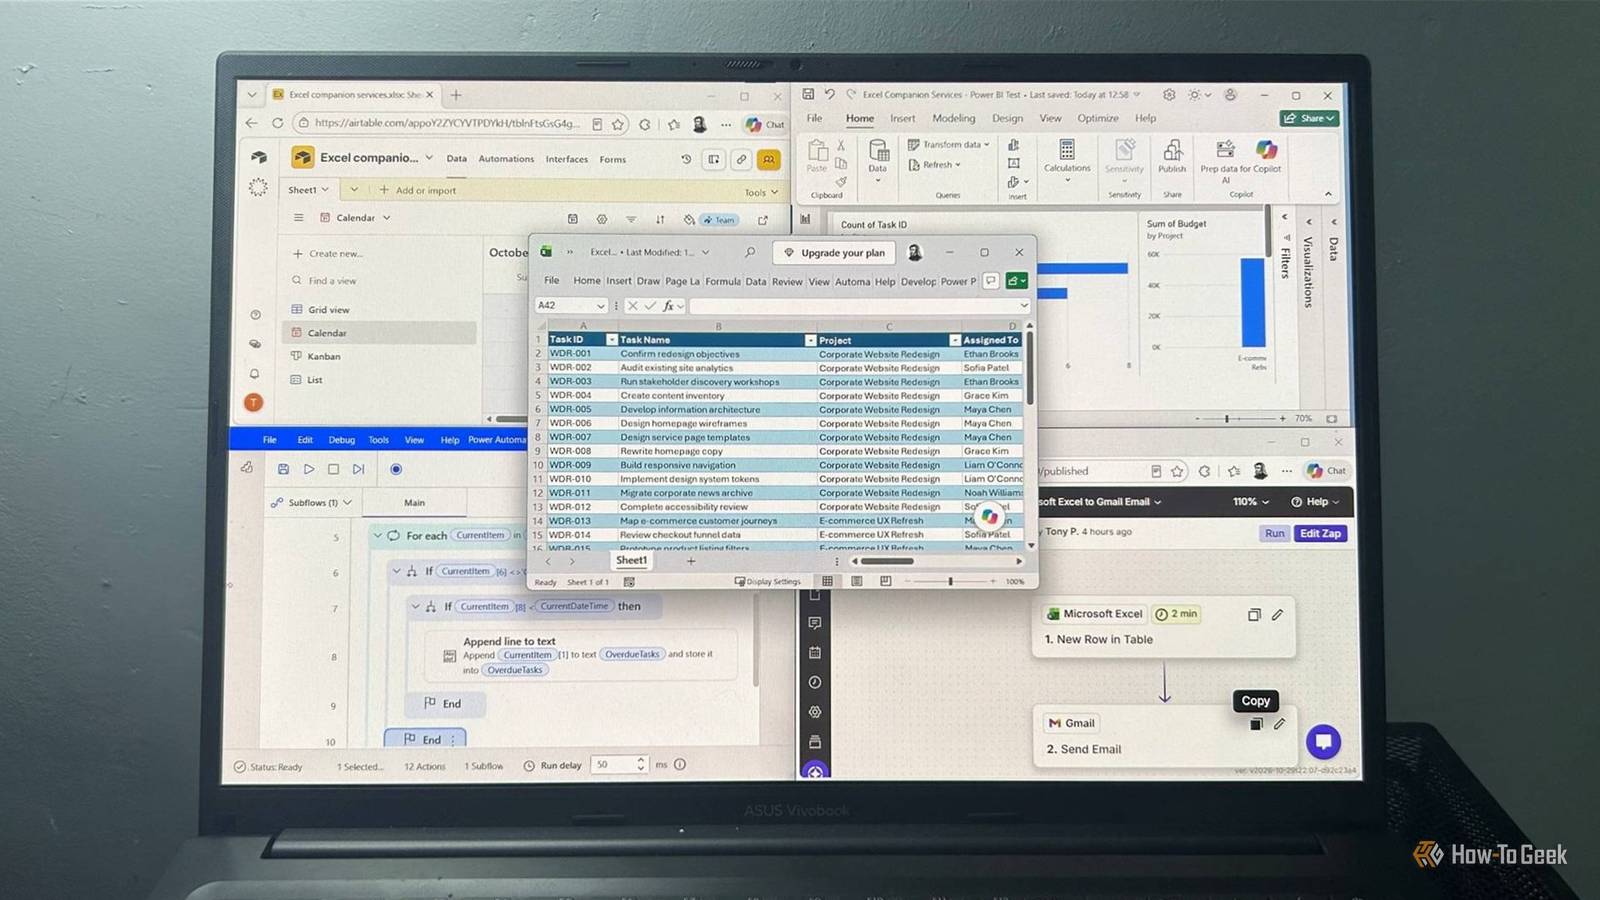
Excel already has plenty of jobs.It organizes information, crunches numbers, and keeps track of things, but there comes a point when trying to make it do everything itself creates more hassle than it saves.So I connected it to four other services and found that I could get much more out of my spreadsheets when I let them handle some of the work around it.
Add How-To Geek on Google Add as Preferred Source Follow on Google Discover Zapier Connect Excel to hundreds of other services Close I'm a big fan of anything that saves me from repeatedly checking whether something has happened, and that's what Zapier does.It connects Excel to hundreds of other services, meaning you can create workflows that kick into action when something changes in a workbook.Its visual editor makes it easy to choose an Excel event, such as adding a new row, and decide what Zapier does next.
For example, I set up a workflow that watches an Excel project tracker and sends me a Gmail notification whenever someone adds a new task.The email includes the task name, so I can see what's been added without opening the workbook.You could use the same idea to send messages to Microsoft Teams or Slack, create records in another service, or trigger other actions.
Zapier's Free plan gives you 100 tasks per month and unlimited two-step Zaps, each made up of one trigger and one action.Just be aware that free-plan Zaps check for new data every 15 minutes, versus every one minute on a paid plan.There's another potential wrinkle for Excel users.
Zapier's documentation says its Excel integration requires a Microsoft 365 Business or Enterprise account and OneDrive for Business.That said, I was able to connect my personal Microsoft account and use a workbook stored in my personal OneDrive.Your experience may differ.
Power BI Turn spreadsheet data into interactive reports Close Excel has plenty of charting and reporting features, but Power BI gives you a dedicated environment for turning spreadsheet data into interactive reports.You can import an Excel workbook and build several visualizations from its data, arranging them on a single report page.Using my project tracker, I created a report showing task counts by status, total budgets by project, and estimated hours by department.
The real magic came when I added a slicer.Picking two projects filtered all three charts at once, so I could explore the figures without fiddling with each visual.I could see how much work a department had, how much budget was allocated to each project, and how many tasks were still open, all in the same report.
Power BI can also pick up changes to the original Excel workbook when you refresh the report.After changing a value and saving the spreadsheet, I refreshed Power BI and saw the corresponding chart update.I didn't have to rebuild the visuals.
Excel can already produce impressive reports using PivotTables, PivotCharts, and slicers.Power BI's appeal is how multiple visuals work together on one canvas.The desktop version is free, but sharing reports with others generally requires a paid Pro or Premium Per User license, unless the content is hosted in qualifying Premium or Fabric capacity.
Airtable Give your Excel data a more flexible workspace Close Airtable is my favorite of these four services, and it's easy to see why.It's a curious hybrid of a spreadsheet and a database that gives you different ways to organize your Excel data.This comes in handy when a regular spreadsheet isn't the best fit for everyone working with it.
I brought my project tracker into a new Airtable base, and all 40 tasks and their associated fields came across successfully.Airtable recognized repeated options and turned them into drop-down fields, while preserving numerical values and even picking up Excel's number formatting.It also displayed status options as colored pills, making them easy to distinguish at a glance.
From there, I could switch between a conventional grid, a calendar showing task deadlines, a Kanban board grouping tasks by status, and a streamlined List view.The Kanban view is especially satisfying.I can drag a task from one status column to another, and the underlying record updates to match.
Switch back to the grid and the task's status has also changed there.That flexibility means different people can work with the same records in whichever layout suits them.A project manager might prefer the grid, someone coordinating deadlines the calendar, and team members updating progress the Kanban board.
One important distinction: importing an Excel workbook creates a copy of its data, not a live connection that synchronizes changes.Airtable's Free plan also has a 1,000-record limit per base.Still, for a project tracker or similar structured list, being able to view and manage records in different ways is genuinely useful.
Power Automate for desktop Automate repetitive tasks using Excel data Close Sometimes, the most useful thing you can do with an Excel workbook is let it handle some of the tedious work.Microsoft's Power Automate for desktop lets you build visual workflows that open Excel files, read worksheet data, and act on what they find.I put together a flow that reads my project tracker, checks each task's status and due date, and collects the names of tasks that are overdue but haven't been marked Complete.
When I run it, Power Automate for desktop pops up a single message with the results.In my tracker, that meant 12 tasks needing attention.I can run the same flow again whenever I want an updated list, without manually checking the rows.
You could adapt the same approach to identify unpaid invoices, compile outstanding orders, or find records that need updating.Instead of scanning rows and comparing dates yourself, you can let a flow do the checking.Power Automate for desktop uses a visual, action-based editor, so you can build workflows with conditions, loops, and variables without writing a traditional macro.
It's especially handy when a task goes beyond spreadsheet cells, like opening files or working with desktop apps.Excel doesn't have to work alone Excel is so versatile you could spend years exploring its features and still find something new.But I've found that getting more out of my spreadsheets doesn't always mean adding another formula or building another feature in Excel.
Sometimes, connecting them to other services is the smarter move.
Read More