Linux ships with plenty of tools for watching what your computer is doing, which is all nice and great, but most feel dated.btop, an open source tool, offers a complete, interactive view of your processor, memory, disks, network, and processes, all inside the terminal.Here is what it is and whether it deserves a spot on your system.
What's btop? A modern terminal monitor built on a lineage of tools Close btop, formally btop++, is a free, open source resource monitor that runs entirely in the terminal.It reports usage and statistics for the processor, memory, disks, network, and running processes on a single screen.Think of it as a far more capable cousin of the classic top command.
It is written in C++, which keeps it quick and light on resources even while it refreshes constantly.The project comes from a developer known as aristocratos and is the third chapter in a family of tools.It began as bashtop, a shell script, then became bpytop, written in Python.
The C++ rewrite that gave btop its name was announced in May 2021, and the Linux version was released as 1.0.0 that September.All of the system data collection was written from scratch, without external libraries.Linux came first, but support for macOS and FreeBSD followed, and a separate Windows port called btop4win lives in its own repository.
Newer releases also added GPU monitoring for NVIDIA, AMD, and Intel hardware, although it requires a binary built with GPU support enabled.For what it's worth, it's actually pretty straightforward.Most major distributions package btop in their repositories, a snap exists for those without a native package, and anyone who prefers can compile it from the GitHub source with make or CMake.
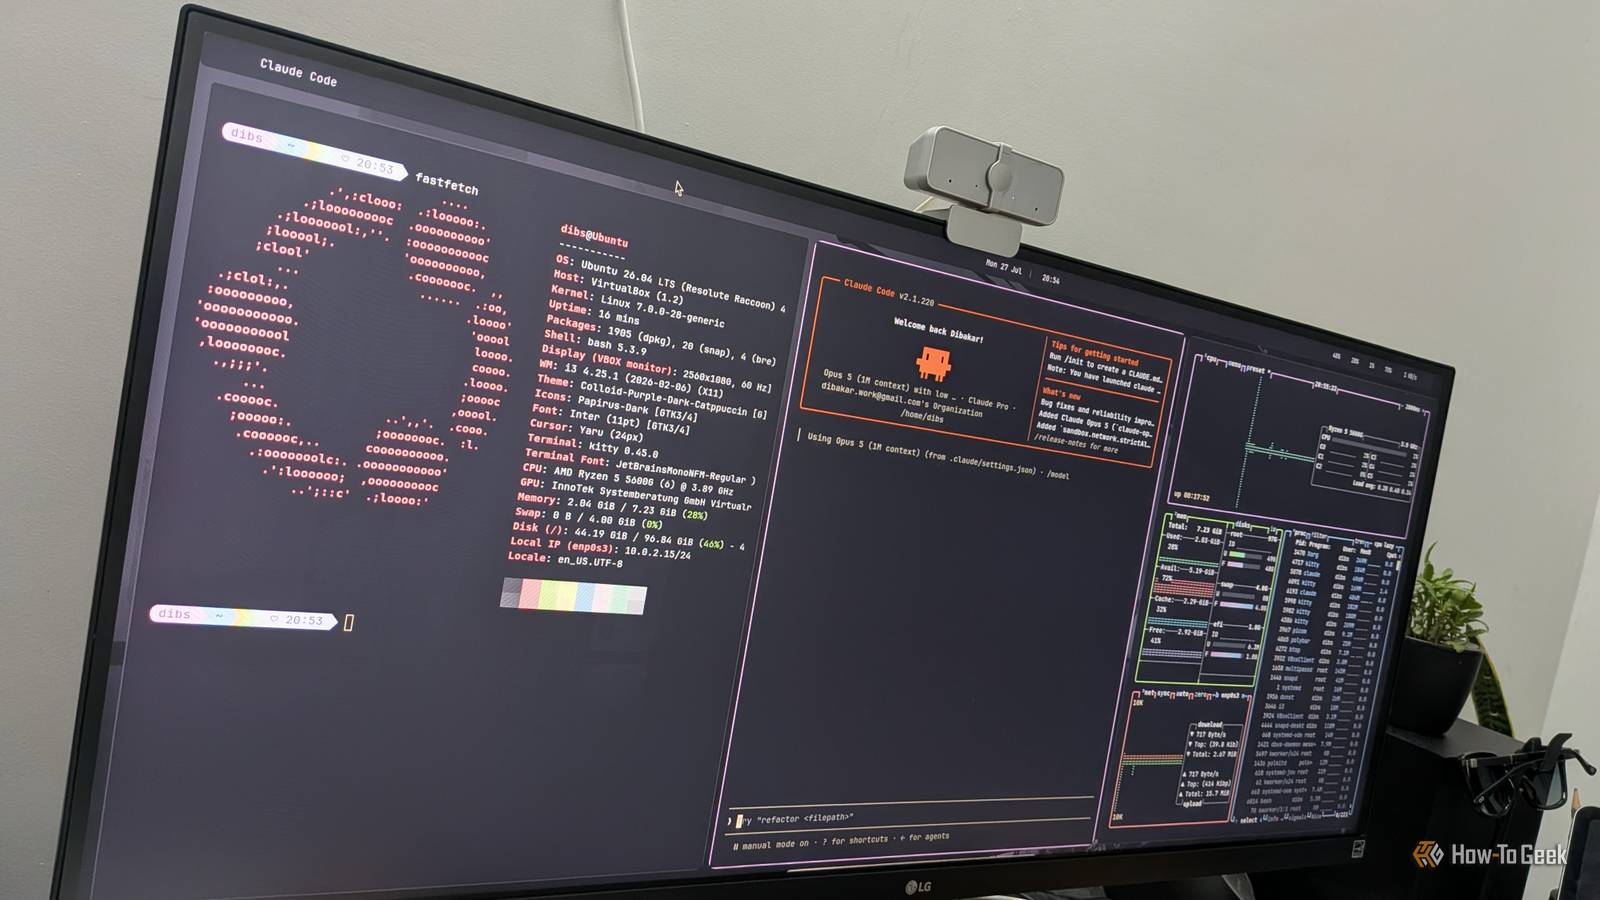
Typing btop in a terminal launches it with no setup required.On launch, you get a colorful dashboard of boxes, graphs, and meters.It looks closer to a desktop utility than a traditional terminal program, and that presentation is the first thing that separates it from the tools it replaces.
Why is it worth using? Live graphs, mouse control, and deep customization in one screen The strongest argument for btop is how much it lets you do without leaving the screen.Where top mostly lists processes, btop pairs that list with live graphs for processor, memory, disk activity, and network traffic.The network graph scales automatically, so a quiet connection and a saturated one are both readable, and the disk section shows input and output activity and speeds.
Laptop users also get a battery meter.Interaction is where it pulls ahead.Full mouse support means every button with a highlighted key can be clicked, and scrolling works in the process list and menus.
Keyboard users can move through processes with the arrow keys, filter the list, switch between sorting options, or flip to a tree view that shows which processes spawned which.Selecting a process opens detailed stats for it, and you can send any signal to it directly.Ending a misbehaving program becomes a matter of a few keystrokes rather than hunting down a process ID.
Customization is deep without being intimidating.A game-inspired menu system lets you change every option in the configuration file from within the interface.You can pick the symbols used for graphs, build custom presets, and load themes.
btop searches system theme directories as well as a user folder under the .config directory, so adding your own look is simple.It is also practical for troubleshooting.When a system slows down, seeing processor, memory, disk, and network pressure side by side helps narrow the cause quickly, and the process list sits right there to act on it.
For anyone who has bounced between several separate tools to answer the same question, consolidating that into one view is the real appeal.Should you use it? A strong default for terminal users, with a few caveats For most Linux users who spend any time in a terminal, btop is an easy recommendation.It is free, packaged almost everywhere, and asks for no setup, so the cost of trying it is a single install command and a few minutes of exploring.
Enthusiasts who like to see their system's activity, and administrators who need to spot a runaway process fast, will likely find it replaces whatever they use now.There are caveats.The interface leans on color and Unicode graph symbols, so it looks best in a modern terminal emulator with truecolor support.
btop does offer a low-color option and a tty mode limited to 16 colors with friendlier symbols, which helps on older terminals or a bare console, but the experience is plainer there.GPU monitoring is not automatic either, since it needs a build with GPU support, and on Intel hardware only utilization, power usage, and clock speed are reported.Context matters too.
On a minimal server where you only need a quick glance, plain top is already installed and may be all you need.Scripts and automated checks are better served by simpler, text-only tools, since btop is designed to be watched rather than parsed.And anyone who strongly prefers a graphical monitor with windows and icons may find a terminal dashboard a poor fit, however polished.
A reasonable approach is to install it alongside what you already use and let habit decide.If you find yourself opening it before anything else, it has earned its place.btop is a worthwhile upgrade for most terminal users btop packs live graphs, process control, and deep customization into one free terminal dashboard.
It suits most Linux users who want clarity into their system's behavior, though minimal servers and graphical-monitor fans may not need it.Installing it costs almost nothing, so trying it is easy.
Read More