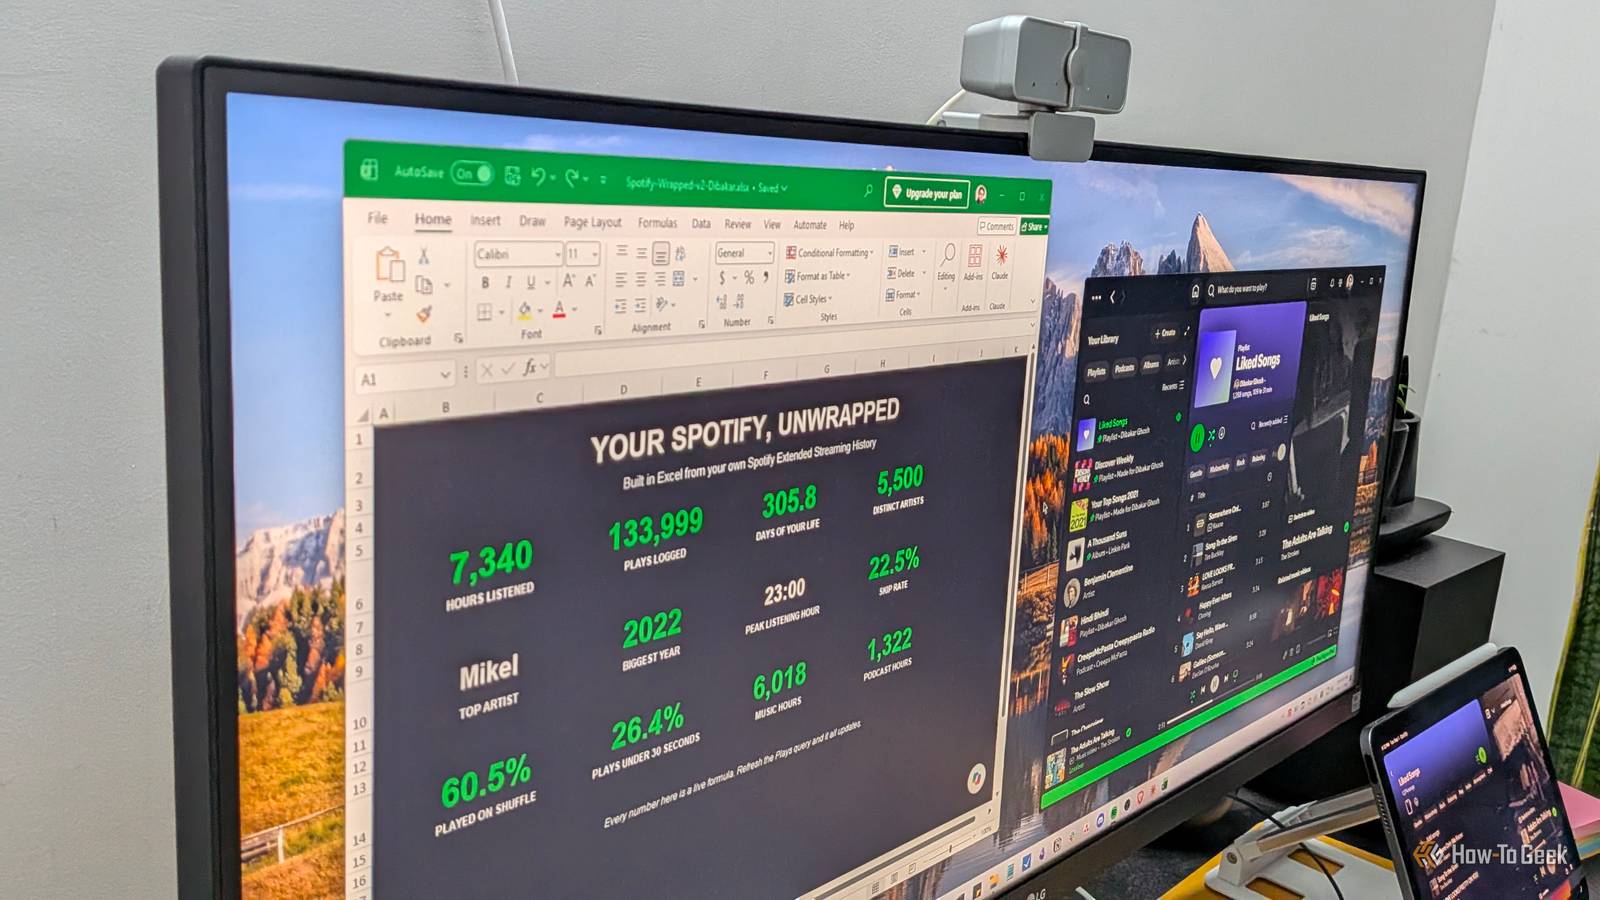
For the past couple of years, Spotify Wrapped has left me underwhelmed.The insights it serves up never feel all that “insightful” — which is strange, because Spotify clearly has a mountain of data on my listening habits.So I decided to get my hands on all that data and build my own Spotify Wrapped.
I requested my full listening data from Spotify and processed it myself in Excel to dig up the kind of insights Wrapped never gives me.Downloading my Spotify data It’s easier than you might think Close First, we need to get our hands on the data.The typical route is by using the Spotify API.
Now, if you're a developer or tech-savvy enough to already know how that works, you don't need me to walk you through it.However, if you don’t want this to get too technical, here’s a much simpler alternative for regular users.Simply open the Spotify web player at open.spotify.com, click your profile icon, and go to your account.
In Account settings, go to Security and Privacy, then Account Privacy.Scroll down, and you'll find the option to Download Your Data.By default, it only selects “Account data.” Uncheck that and select “Extended streaming history” instead — that's the one that gives you your lifetime streaming history, which is what unlocks all the useful insights.
Now, click “Request Data,” and you should get an email asking you to confirm your data download request.While the website says the process can take up to 30 days, in my experience, it’s nowhere near that long.I requested my extended streaming history on August 26 at 4:30 a.m., and the download link landed in my inbox the next day, on August 27 at 4:36 a.m.
I imagine the turnaround might depend on how much data is in your account.Mine was created back in March 2019 and has over 133,000 plays logged, which I'd consider a fairly big account, and it still only took a day.So that's roughly what you can expect.
Related 5 brand new Spotify features that I can't get enough of, and how to use them Take your streaming to the next level.Posts 1 By T.M.Amrita Importing the Spotify data into Excel What Spotify sends you isn’t quite legible — yet Close Once the download is ready, Spotify hands you a ZIP file.
Unzip it, and you'll end up with a bunch of JSON files containing your streaming history.Spotify doesn’t hand you a ready-made spreadsheet, so the next job is importing all those JSON files into Excel yourself.The simplest way is by using Power Query.
If you're already familiar with it, you can probably take it from here.If not, here's the step-by-step process: Open Excel.Create a new file, and save it first — call it "Spotify Wrapped" or whatever you like.
Go to the Data tab and click Get Data -> From Other Sources -> Blank Query.In the Power Query window that opens, click Home -> Advanced Editor, delete everything there, and paste in the code snippet I'm sharing below.You'll find the code snippet to paste into the Advanced Editor at the bottom of this article for convenience.
This part is important.Before you hit OK, there are two things you need to change in the code.First, set FolderPath to the specific folder where all your Spotify JSON files live.
The second is the TZ_OffsetHours value, which tells the query how far your time zone is from UTC.Without this adjustment, all your listening times will be shifted, and you won't be able to accurately see when you were actually streaming.For reference, US Eastern is -5, and US Pacific is -8.
After tweaking the code, click Done, then go to Home -> Close & Load -> Close & Load To, choose Table and New Worksheet, and hit OK.And that’s it; you’ve successfully imported all your Spotify data into Excel.Give it a couple of minutes if your history is huge — it took around 90 seconds for me, and then all 133,999 plays stretching back to March 2019 were sitting in the spreadsheet.
Here's my Excel-powered Spotify Wrapped It might not be pretty — but it’s comprehensive Close With all the data in Excel, it's time to process it and pull out meaningful insights.Now, I won't claim to be the most creative person when it comes to data extraction, and I'm definitely not a graphic designer.But I had a clear vision of what I wanted to see, and I built it all with Excel PivotTables.
First, the overview sheet shows total plays, total hours, music time versus podcast time, skip rates, and a year-by-year breakdown of it all.Then there's the listening clock, where I charted which hours of the day I listened to music, year by year — in 2022, for instance, most of my listening happened between 7 and 11 p.m.There's also a day-by-day breakdown along the same lines.
Also, if you look at my listening clock, it suggests I listen to Spotify at basically all hours of the day.That's not actually true — it's a side effect of the aggregation.Because of my job, I shift through sleep cycles: sometimes I sleep during the day and work at night, other times it's the reverse.
Aggregate years of that, and it looks like I never stop listening.So I built the circadian drift sheet to visualize how my schedule actually drifts over time.Other than this, I built a view to see which devices I listened to Spotify on and how much.
I also built a top artists list — when I listened to them, in which years, and how many times.Granted, none of this looks as pretty as Spotify's official Wrapped — but it’s a lot more insightful, which is what I was after.That said, if you're graphically inclined, you could always pull the key numbers into something like Canva and design a good-looking graphic out of them.
Related Spotify launches listening stats, a weekly deep-dive into your music habits Spotify's new feature unlocks the truth about your listening habits.Posts By Derek Malcolm You can use AI if you aren't well-versed in pivot tables You don’t have to know Excel to process your data I'm sharing my sheet so you can look at the pivot tables I built and reuse them for your own data: Spotify Wrapped Excel Sheet with Built-in Pivot Tables.It’s an XLSX file hosted on Google Drive.
Please download it to your system and open it in Excel to avoid potential errors and glitches.That said, if you want access to a particular metric I haven't built, and you don't know how to create pivot tables yourself, you can always use AI.In fact, some of the pivot tables in my sheet were actually built with Claude's help.
You can connect Claude to Excel and have it build them for you.Alternatively, you can just give Claude the master data table we imported earlier and ask it to process it, calculate whatever you're curious about, and surface those specific nuggets of information.Related I asked Claude to build 3 Excel automations—and it saved me hours of manual work From creating spreadsheets to generating PDF reports, Claude handled far more of the workbook development than I expected.
Posts 3 By Tony Phillips And as promised, here's the Power Query code to paste into Excel's Advanced Editor: let // ======== EDIT THESE TWO LINES ======== FolderPath = "C:\Users\YOU\Documents\Spotify Extended Streaming History", TZ_OffsetHours = 5.5, // ====================================== Source = Folder.Files(FolderPath), OnlyAudio = Table.SelectRows(Source, each Text.Lower([Extension]) = ".json" and Text.StartsWith([Name], "Streaming_History_Audio")), Parsed = Table.AddColumn(OnlyAudio, "Data", each Json.Document([Content])), KeepData = Table.SelectColumns(Parsed, {"Data"}), ToRows = Table.ExpandListColumn(KeepData, "Data"), Expanded = Table.ExpandRecordColumn(ToRows, "Data", {"ts", "platform", "ms_played", "conn_country", "master_metadata_track_name", "master_metadata_album_artist_name", "master_metadata_album_album_name", "spotify_track_uri", "episode_name", "episode_show_name", "reason_start", "reason_end", "shuffle", "skipped", "offline", "incognito_mode"}, {"ts", "Platform", "ms_played", "Country", "Track", "Artist", "Album", "Track URI", "Episode", "Show", "Reason Start", "Reason End", "Shuffle", "Skipped Flag", "Offline", "Incognito"}), UTC = Table.AddColumn(Expanded, "UTC", each DateTime.FromText(Text.Replace([ts], "Z", "")), type datetime), PlayedAt = Table.AddColumn(UTC, "Played At", each [UTC] + #duration(0, 0, 0, TZ_OffsetHours * 3600), type datetime), Mins = Table.AddColumn(PlayedAt, "Minutes", each [ms_played] / 60000, type number), Yr = Table.AddColumn(Mins, "Year", each Date.Year([Played At]), Int64.Type), Mo = Table.AddColumn(Yr, "Month", each Date.Month([Played At]), Int64.Type), Dw = Table.AddColumn(Mo, "Weekday", each Date.DayOfWeekName([Played At]), type text), Hr = Table.AddColumn(Dw, "Hour", each Time.Hour([Played At]), Int64.Type), Kind = Table.AddColumn(Hr, "Content", each if [Track] <> null then "Music" else if [Episode] <> null then "Podcast" else "Other", type text), Device = Table.AddColumn(Kind, "Device", each let p = Text.Lower([Platform]) in if Text.Contains(p, "android") then "Android" else if Text.Contains(p, "ios") then "iOS" else if Text.Contains(p, "osx") or Text.Contains(p, "mac") then "macOS" else if Text.Contains(p, "windows") then "Windows" else if Text.Contains(p, "linux") then "Linux" else if Text.Contains(p, "web") then "Web Player" else if Text.Contains(p, "cast") or Text.Contains(p, "partner") then "Speaker / TV" else "Other", type text), Skip = Table.AddColumn(Device, "Skipped", each if [Reason End] = "fwdbtn" then 1 else 0, Int64.Type), ShortPlay = Table.AddColumn(Skip, "Short Play", each if [ms_played] < 30000 then 1 else 0, Int64.Type), Cleaned = Table.RemoveColumns(ShortPlay, {"ts", "UTC"}) in Cleaned
Read More