PivotTables can summarize thousands of rows in Excel in seconds, yet many people still waste time filtering raw data, building duplicate reports, and writing formulas that already exist inside the tool.These five overlooked tricks eliminate that extra work and have become part of my everyday workflow.Double-click any value to see the source data Dive deeper into PivotTable records I discovered this trick entirely by accident when investigating a sudden spike, and it instantly changed how I troubleshoot and validate numbers.
Suppose you want more details behind one of the values in your PivotTable.Rather than flicking between tabs and losing momentum: Locate and double-click the PivotTable value you want to investigate.Review the newly generated worksheet containing only the source rows for that value.
When your review is complete, right-click the new sheet tab at the bottom of your window and click Delete.Generate a separate worksheet for every category Stop copying and pasting separate files This is the PivotTable feature that saved me the most time last year.I used to duplicate PivotTables and waste hours whenever different people needed filtered versions of the same report.
However, a dedicated PivotTable feature handles this entire distribution task automatically.For example, if your report is filtered by region or manager, Excel can instantly generate one worksheet for each category in the filter list in no time at all.First, set up the automation: Drag the categorical field you want to split into the Filters box of the PivotTable Fields pane.
Click inside the PivotTable to bring up the contextual ribbon tools.Open the PivotTable Analyze tab.Click the small drop-down arrow right next to the Options button on the far left.
Choose Show Report Filter Pages from the contextual drop-down menu.Then, to generate the sheets: Verify that the selected filter field in the pop-up dialog box matches your target column.Click OK to run the sheet generation automation.
Click through the newly created worksheet tabs to see the individual reports.To export a specific report, right-click a worksheet tab, then click Move or Copy.Microsoft 365 Personal OS Windows, macOS, iPhone, iPad, Android Free trial 1 month Microsoft 365 includes access to Office apps like Word, Excel, and PowerPoint on up to five devices, 1 TB of OneDrive storage, and more.
$100 at Microsoft Expand Collapse Use Distinct Count to track unique values Tally items without duplicates One of the first major limitations I ran into with PivotTables was that I couldn't count unique items instead of just the total.Standard PivotTables only offer a basic count calculation, meaning if a single customer makes five separate purchases, a normal count returns 5.By adding the source data to Excel's Data Model when first creating the table, you unlock a hidden distinct count option that ignores duplicate entries completely.
Start by initializing Excel's Data Model workspace: Select your raw source table and open the Insert tab.Click PivotTable to open the standard creation dialog box.Choose your destination worksheet location.
I tend to place them on new worksheets so the source data and the PivotTable are cleanly separated.Check the Add this data to the Data Model box.Click OK to generate your new PivotTable.
Now, your setup is ready to switch your summary to a distinct count: Drag your identifying field into the Values box.Right-click any number inside that newly added column and select Value Field Settings.Scroll down the calculation list and click Distinct Count.
Click OK.The PivotTable immediately updates to show a distinct count, meaning each customer is only counted once per region, regardless of how many purchases they made.Group related items without adding helper columns Consolidate messy categories directly inside the PivotTable I often receive datasets from other systems with overly specific categories that need to be grouped into broader buckets before they're useful for reporting.
Instead of modifying the master database or creating helper columns, I handle the consolidation directly within the PivotTable itself.Here's how to create and clean up custom groups: Hold Ctrl while clicking each individual text label in your rows that belongs in your first custom group.With those items still selected, right-click any one of them, then select Group.
This action will initially make the PivotTable look messy, so right-click the leftmost PivotTable column header and select Expand/Collapse > Collapse Entire Field to tidy things up.Select the cell containing the generic group label (such as Group1), then overwrite the existing text with a more understandable name and press Enter.After repeating the selection, grouping, and renaming steps for the remaining items: Right-click your newly created parent field header in the grid.
Click Field Settings.Rename the field to reflect the category it represents, then click OK.While overwriting individual group labels in the PivotTable grid is perfectly valid and only affects how those items appear, the field header at the top represents the underlying grouped field itself, not a single label, which is why you need to use the Field Settings route.
Now all related items and their associated numeric values are grouped together, so you can quickly summarize categories, spot higher-level trends, and produce cleaner reports without manually restructuring your source data.Calculate month-over-month growth without writing formulas Let PivotTables handle the math Before I discovered this calculation feature, I regularly exported PivotTable data and built manual growth formulas that would completely break whenever the data refreshed.The native Show Values As option works perfectly for month-over-month, quarter-over-quarter, and year-over-year dynamic reporting.
Deals Unlock deals on productivity software and subscriptions Explore discounts on software, AI tools, and subscription services that boost spreadsheet productivity.Shop deals on office suites, add-ins, templates, training, and collaboration platforms to save on tools that streamline reporting and analysis.Deals Explore Software, AI & Subscriptions Deals To configure a period-over-period growth view: Drag your core performance number into the Values box a second time so it appears duplicated in your grid.
Right-click any cell inside that newly duplicated values column.Hover over Show Values As, then select % Difference From.Set the Base Field drop-down option to the Month field created from your Date grouping.
Set the Base Item drop-down option to (previous), then click OK.Now that the PivotTable successfully displays month-over-month percentage differences, you can click the header of the duplicated values column and rename it directly in the PivotTable grid (for example, Month-over-Month Growth).Since this is only a display label change, not a change to the underlying calculation, you're fine to rename it here.
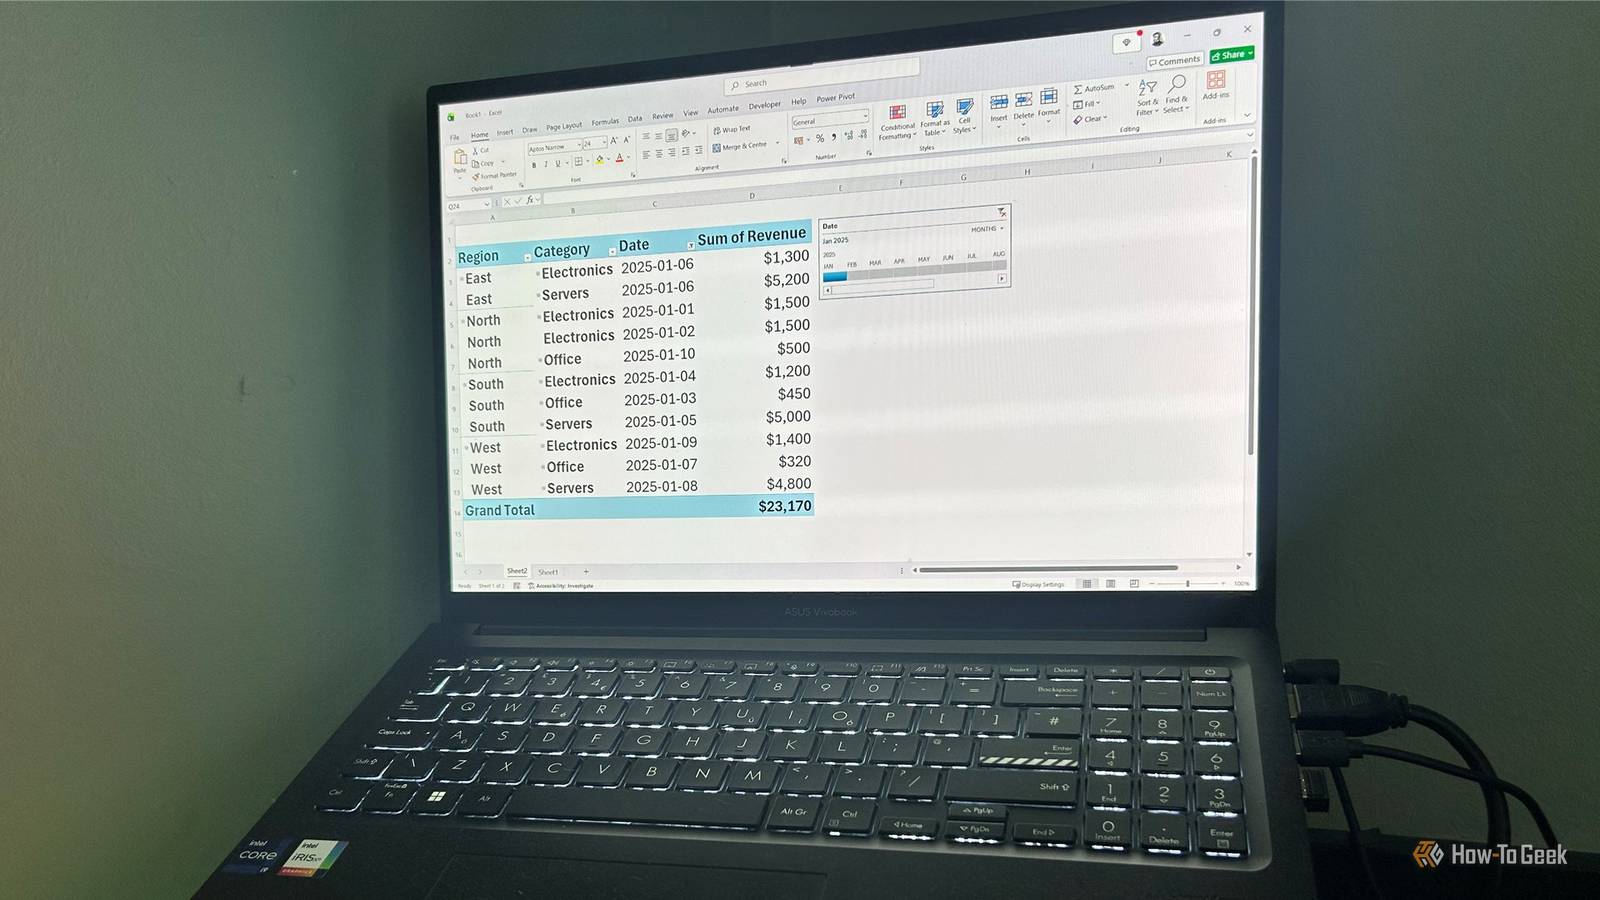
Add new data to your source table, refresh the PivotTable, and the calculations will update instantly without breaking your structure.Smarter PivotTables, less manual work I've stopped building duplicate reports and writing extra formulas since using these PivotTable tricks—they've streamlined how I work with large datasets and made reporting far more efficient.Beyond these five workflow upgrades, you can take PivotTables further by adding slicers and timeline filters.
Read More