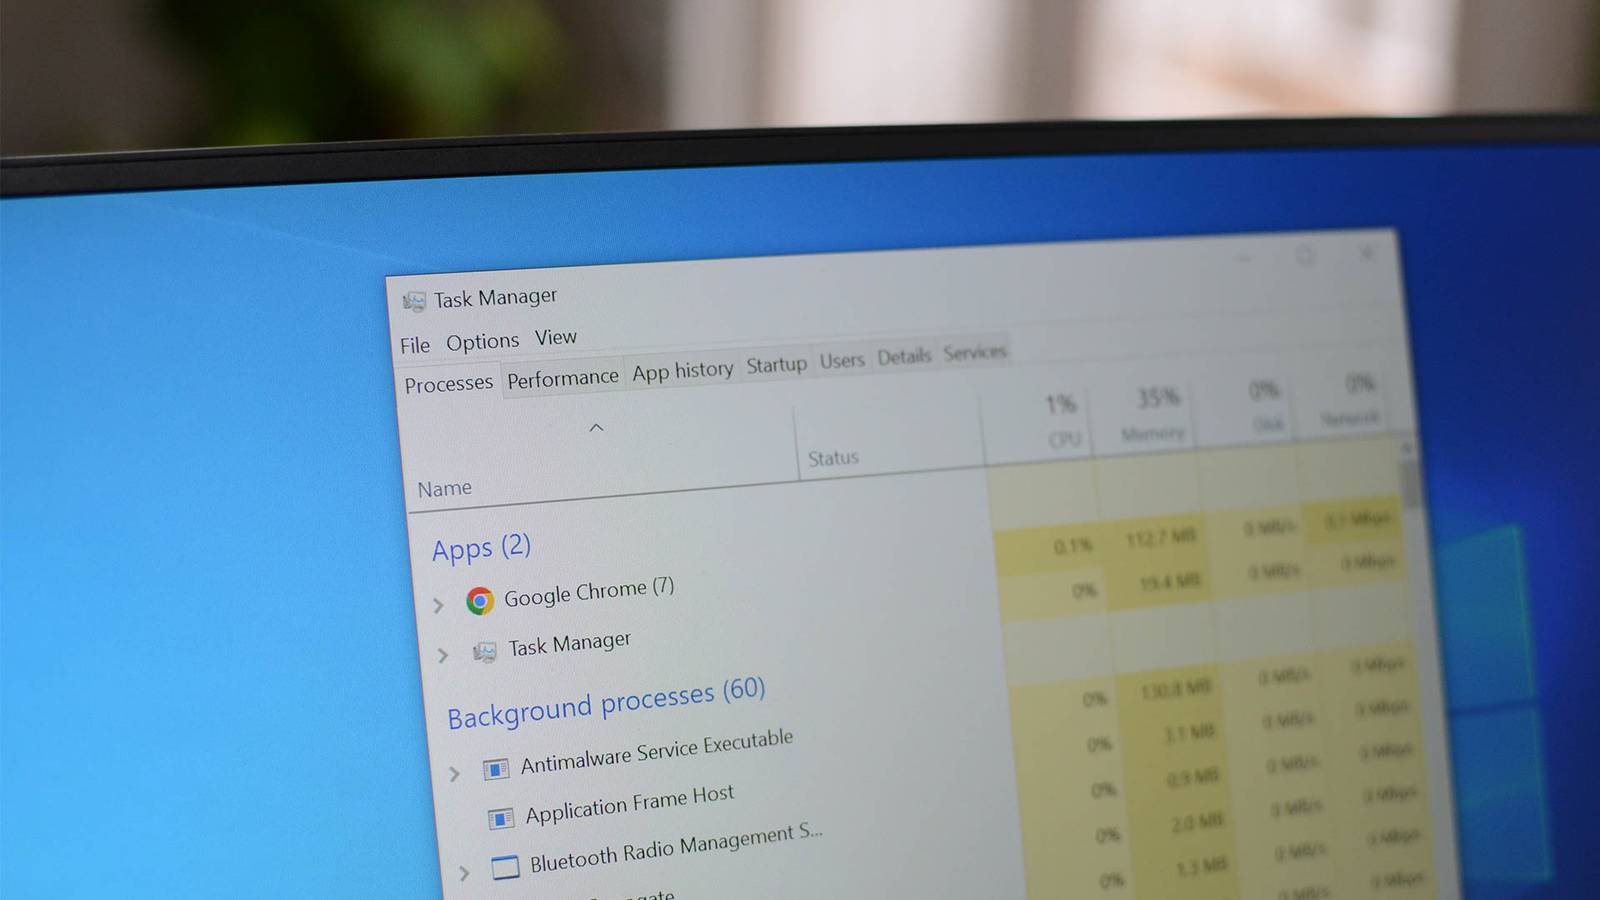
If you're the person friends and family call when their computer starts acting weird, you've probably opened Task Manager more times than you can count.It's the first place most of us go when a PC feels slow, an app stops responding, or the fans suddenly spin up for no obvious reason.For decades, it has been Windows’ built-in diagnostic dashboard, presenting CPU, memory, disk, and GPU activity in neat graphs that look authoritative enough to settle debates about what’s slowing your PC down.
The problem is that those numbers aren't always telling the full story.Task Manager isn't intentionally misleading anyone, but it simplifies and aggregates a lot of complex system behavior into percentages and labels that are easy to misunderstand.In other words, maybe "lying" is a strong word, but if you don't know what those metrics actually represent, it can feel pretty close.
Once you understand what Task Manager is really measuring, many of those scary spikes and confusing readings start to make a lot more sense.That CPU usage number can be misleading Task Manager averages activity across cores, spikes, and changing clock speeds At first glance, CPU usage looks simple.If Task Manager says the processor is sitting at 25%, most people assume their CPU is only doing a quarter of the work it could be doing.
In reality, that percentage is a blended snapshot of activity across all cores and threads, averaged over a short period of time.On a modern 8-core or 16-thread processor, a single busy thread can push one core close to 100% while the rest sit mostly idle.Task Manager rolls that into one overall number, which makes it easy to miss situations where one core is doing all the heavy lifting.
The way Windows schedules workloads also complicates the picture.The scheduler constantly moves tasks between cores to balance performance and efficiency, while background services wake up, do a little work, and then go back to sleep.On top of that, CPU speeds aren't fixed anymore.
Modern processors jump between base clocks and turbo frequencies depending on load, thermals, and power limits.Task Manager tries to smooth all of this into readable graphs, but what you're seeing is really a mix of short spikes, moving workloads, and fluctuating clock speeds compressed into a single percentage.It's useful for spotting obvious problems, but it's not nearly as precise as it looks.
If you want a clearer picture of what's actually happening, tools like Resource Monitor or Process Explorer can break CPU usage down by core, thread, and process.Task Manager prioritizes quick readability, which means it often hides the complexity underneath.You can switch the CPU graph to show individual cores by right-clicking it and choosing Change graph to > Logical processors, but the default view still prioritizes a single overall percentage that doesn't show the full picture.
That RAM usage bar isn’t telling the whole story Windows fills unused RAM with cached and standby data that can be reclaimed Memory usage is another area where Task Manager can look more alarming than it really is.When people see RAM sitting at 80% or 90%, the natural reaction is to assume the system is nearly out of memory.In practice, a large portion of that "used" memory is often working for Windows in ways that don’t actually prevent other programs from running.
Cached and standby memory are good examples.Windows keeps recently used files and data in RAM so they can be accessed quickly later.If an application suddenly needs more memory, the system can reclaim that cached space almost instantly.
Modern versions of Windows also use techniques like memory compression to squeeze more data into RAM before resorting to the slower page file.On top of that, some memory is reserved for hardware and system components, including shared GPU memory that integrated graphics borrow from system RAM when needed.Task Manager rolls all of these categories into a simple usage bar, which makes it easy to assume the system is running out of memory when it’s really just using available RAM efficiently.
If you want a clearer picture of what’s actually happening, tools like Resource Monitor can break memory usage into more detailed categories, such as in use, standby, and free.Performance Monitor can go even deeper by exposing the raw Windows memory counters that Task Manager summarizes.Those tools reveal that what looks like full RAM in Task Manager is often just Windows putting otherwise idle memory to good use.
That "100% disk usage" warning doesn't mean your drive is maxed out Task Manager measures drive activity, not how fast data is actually moving Disk usage is another metric in Task Manager that can look far more dramatic than it really is.When the Disk column suddenly jumps to 100%, it's easy to assume the drive is transferring data at maximum speed and the system has hit a hard bottleneck.In reality, that percentage isn't measuring raw throughput.
It's measuring how busy the drive is responding to requests.A drive can show 100% usage even while moving relatively small amounts of data if it's struggling to keep up with lots of tiny operations.That situation is common when Windows or an application is performing many small random reads and writes.
Each request has to be processed individually, and the drive may end up with a growing I/O queue waiting to be processed.Slower drives, especially older hard drives, can hit this kind of saturation quickly.From Task Manager's perspective, the disk is "fully utilized," even though the actual data transfer rate might be surprisingly low.
Subscribe to the newsletter for clearer Windows insights Want clearer Windows troubleshooting guidance? Subscribe to our newsletter for concise, practical breakdowns of Task Manager metrics, deeper tool walkthroughs (Resource Monitor, Process Explorer), and the context you need to interpret performance data.Get Updates By subscribing, you agree to receive newsletter and marketing emails, and accept our Terms of Use and Privacy Policy.You can unsubscribe anytime.
If you want a clearer picture of what's really happening, tools like Resource Monitor provide much more useful disk data.It shows the actual read and write speeds, the number of I/O operations, and the disk queue length, which is often the real indicator that a drive is under pressure.Performance Monitor can go even deeper by exposing the underlying disk performance counters that Task Manager summarizes.
Those tools reveal whether your storage is truly maxed out or just busy dealing with a flood of small requests.Task Manager’s simple percentages hide a lot of complex system behavior Task Manager is still one of the most useful diagnostic tools built into Windows.When a system starts slowing down or an application refuses to cooperate, it's often the fastest way to see which part of the system is under pressure.
The problem isn't that the tool is wrong.It's that the numbers it shows are simplified summaries of much more complicated system behavior.Once you understand what those metrics are actually measuring, the graphs and percentages start to make a lot more sense.
High RAM usage might just mean Windows is caching data efficiently.A CPU sitting at 25% might still have a single core working flat out.And a disk pegged at 100% might simply be dealing with a flood of small requests.
Task Manager is great for spotting trouble quickly, but when you need the full story, Windows has deeper tools that reveal what's really going on behind those numbers.Windows 11 Pro $29.99 $199 Save $169.01 $29.99 at StackSocial Expand Collapse
Read More