I'm forever creating dashboards in Excel, and while I get a lot of satisfaction from it, that's part of the problem.I end up going down a rabbit hole, adding more charts, and then wondering whether I left anything out.There's no handbook for creating a dashboard in Excel, as every dataset is different.
So I decided to let Gemini do the decision-making for me.I gave Gemini my spreadsheet data and a single instruction I wanted it to decide what mattered Close I started with two CSV files containing a small library dataset: 40 authors and 180 books.I used CSV files rather than XLSX files because, in my experience, AI chatbots tend to handle datasets better when I strip out all the Excel-specific baggage.
The files were linked by the AuthorID column, but I deliberately didn't explain this to Gemini—I wanted it to discover the relationship between them on its own.I kept my actual instruction surprisingly short.Instead of specifying a layout or telling it which charts to use, I simply gave it the data and asked it to analyze what it had been given before deciding what would make the standalone offline app useful.
I did make sure it included the ability to add and manage authors and books, export the data, reset it, and keep my changes between sessions.Those were important because I wanted to test whether the finished app could actually replace the sort of ongoing spreadsheet workflow I had in mind, rather than simply produce a nice-looking demo.But that was essentially it.
I was interested in seeing whether it could make sensible design decisions from the data itself, rather than simply following a detailed specification I'd written.Why Gemini? I've tested AI for various different projects in the past, and Gemini has often come out on top.For example, I found that Gemini was better than ChatGPT at turning my data into a dashboard in Excel.
I've also compared how Gemini and Claude coped with turning a spreadsheet into an offline app, and Gemini's output felt more practical and usable.So I wanted to see whether Gemini could go one step further: take two separate CSVs, understand the relationships between them, and generate a standalone interactive app.Gemini built a dashboard I actually wanted to look at It didn't try to visualize everything Close The result was much more restrained than some of the dashboards I've built myself—but that's a good thing.
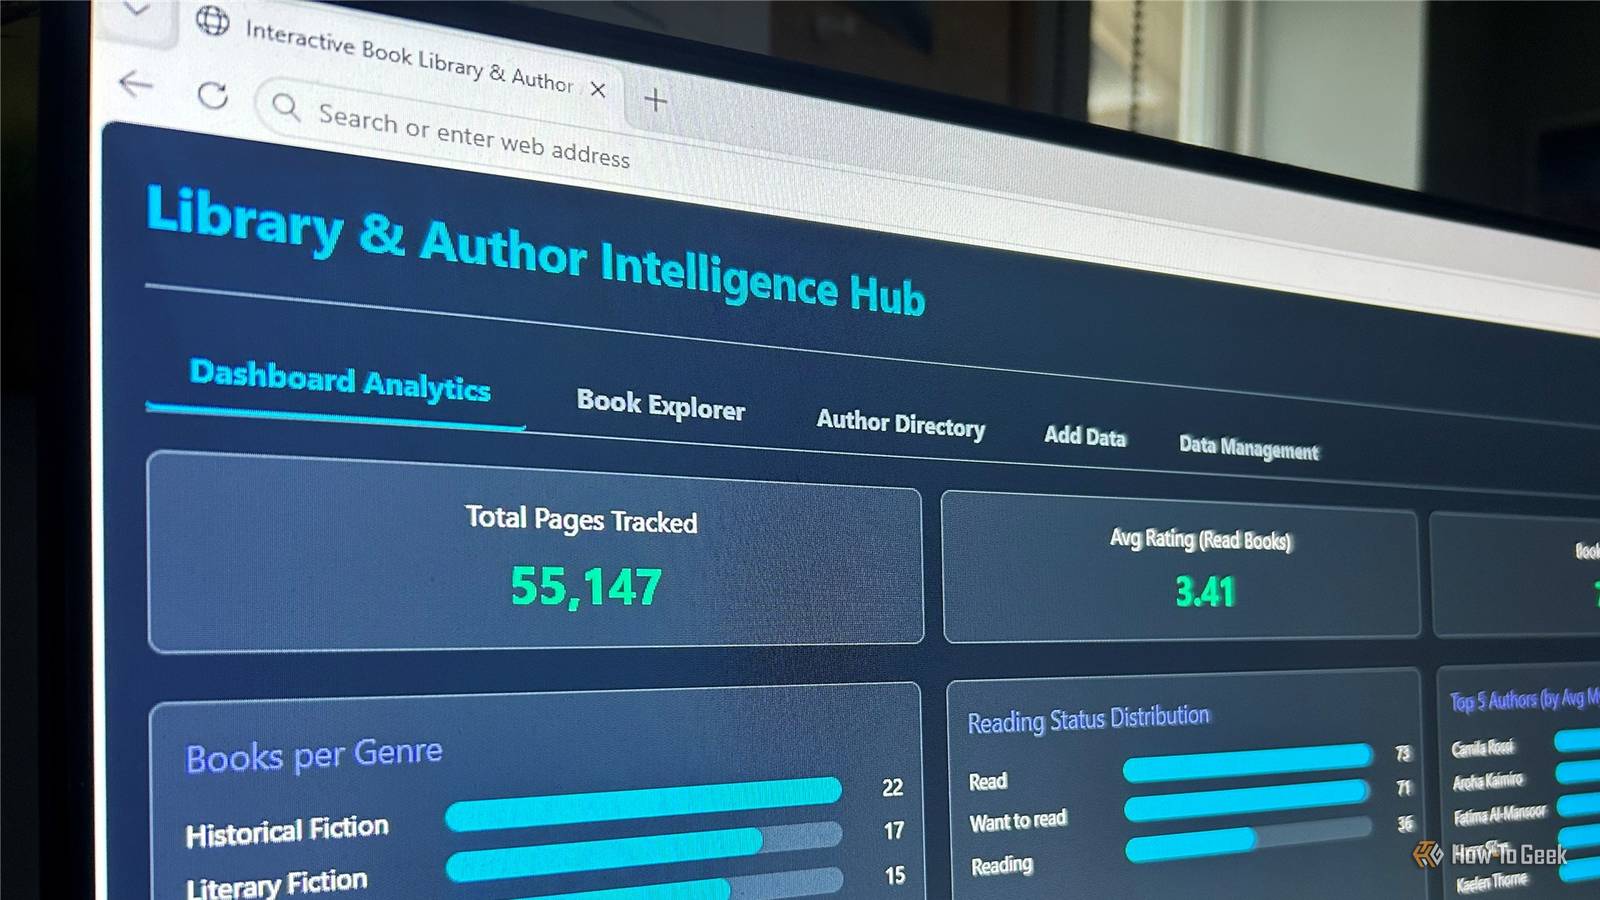
Gemini built a clean overview with four summary cards that show key information from the library, including the number of authors and books, the number of pages read, and the average rating.Underneath, it used four straightforward bar charts showing books by genre, reading status, top authors by average rating, and authors by country.What impressed me most was what Gemini do.
It could have filled the screen with pie charts, percentages, and other visualizations simply because the data was available.Instead, it made a judgment about how much information belonged on the main screen and left the rest alone.It also gave the app a proper navigation structure.
I could move between the overview, Book Explorer, and Author Directory, then drill into individual authors or books when I wanted more detail.Author information, for example, wasn't dumped onto the main dashboard.I had to click through to see an author's details and bibliography.
Close In Excel, I'd have to make those decisions myself, then build the worksheets, navigation, links, filters, and supporting elements to make everything work together.Gemini simply made the choices for me.A good-looking app is useless if the data doesn't work I put Gemini's creation through its paces Once I liked the look of it, I wanted to see whether the app was actually usable.
I opened the Book Explorer first, where I could search by title or author, filter by genre and reading status, and sort the results by title, rating, publication year, or page count.These controls worked together, too, so I could, for example, filter the library by a particular genre and reading status and then search within those results.Close Next, I made some changes to the data in the app to see how it reacted.
First, I added an unread book to an existing author.The book count updated to 181 instantly, the new title appeared in the catalog, the author relationship was correct, and the author's bibliography reflected this change.Close I then added a read book for the same author and gave it a rating of 5.
Gemini handled the rating logic correctly: the rating field only became active when I selected Read, while books marked Reading or Want to read could be added with the rating left blank.Next, I added a completely new author and then created a book for that author.The counts in the top-right corner updated, the new book was correctly associated with the new author, and the author's book count and other derived information updated accordingly.
Close When I refreshed the page, my changes remained, and the same was true when I closed and reopened the HTML file.The whole thing also worked offline, which was one of my original requirements.And when I exported both the Books and Authors datasets as CSV files, the new records and their relationships were included.
Finally, I reset the app, and everything returned to the original 40 authors and 180 books.Gemini made some surprisingly good decisions But there's one thing to be aware of I've run lots of experiments on making AI tools produce working code, so I wasn't surprised that Gemini could generate a working app from spreadsheet data.But what surprise me was the quality of the decisions behind the app.
The overview wasn't overloaded, the four charts were easy to understand, the summary cards gave me the headline figures, and deeper information was available when I needed it rather than being pushed onto the main screen.That restraint is probably the part I'd find hardest to reproduce if I started building the interface myself.Gemini effectively acted as the person saying, "That's enough." One thing I'd keep in mind, though, is the size of the dataset.
In an earlier experiment with a much larger dataset of around 5,000 records, Gemini struggled to embed something of that size into a single standalone HTML app.That wasn't an issue with this 180-book library, but if I were working with a much larger dataset, I'd consider manipulating or reducing the data first rather than expecting Gemini to package everything into one file.Gemini gave me something that felt like a real app I set out to escape my usual Excel dashboard rabbit hole, where I would normally keep adding charts and tweaking the layout until I convinced myself everything was covered.
This time, I handed those decisions to Gemini, and the result was an app that felt like it had been designed around my data rather than around Excel.
Read More