My phone is full of life-tracking apps, but it became increasingly apparent that they don't talk to each other.So, I decided to try logging my sleep, spending, routines, food, and work in Excel for a week to see whether consolidating everything would make the data easier to understand.By Sunday, patterns had started to emerge that I wasn't previously aware of.
If you want to try the same experiment, download a blank copy of this workbook template for free.After you click the link, you'll find the download button in the top-right corner of your screen.What my daily tracking actually looked like Several apps, one disconnected routine On paper, my routine wasn't complicated.
But in practice, it meant jumping between apps throughout the day.Sleep, workouts, food, spending, and work all lived in different places, and while each one worked fine in isolation, none of them shared context.A bad night of sleep never showed up next to too much screen time, and I never explicitly linked a stretch of low-energy habits to a slow day at my desk.
That separation is what prompted me to try using Excel.I set up a single workbook with five named tabs: Sleep, Habits, Food & Drink, Work, and Spending, plus another Dashboard worksheet that brought all metrics together.Nothing complex—just a shared structure where everything could exist in the same format instead of being scattered across apps.
Microsoft 365 Personal OS Windows, macOS, iPhone, iPad, Android Free trial 1 month Microsoft 365 includes access to Office apps like Word, Excel, and PowerPoint on up to five devices, 1 TB of OneDrive storage, and more.$100 at Microsoft Expand Collapse The structure that made the experiment work Building a system simple enough to survive a week Each tab stayed intentionally lightweight so that I would actually keep using it.Sleep went into a named table (T_Sleep), where I logged bedtime and wake time in hh:mm format.
Hours slept were calculated automatically using: =MOD([@[Wake Time]]-[@Bedtime], 1)*24 Related How to Use Excel's MOD Function to Solve Real-World Problems MOD is more versatile than you might think.Posts 1 By Tony Phillips Instead of overengineering the setup, I recorded screen time manually on a scale from 1 (low) to 3 (high) based on how much time I had spent on my phone before bed.Conditional formatting handled the feedback, with lower sleep values turning red and better nights shifting green.
Habit tracking lived in T_Habits, with one row per habit per day and a simple checkbox for completion.From there, I built T_HabitComp, which counted completed habits per day using: =COUNTIFS(T_Habits[Day], [@Day], T_Habits[Completed], TRUE) That fed directly into the dashboard, alongside a split between general habits and movement-focused ones like workouts and walks.Food and drink sat in T_FoodDrink, structured as three entries per day for meals.
Coffee was logged at the top of each day's entry, and takeouts were flagged with checkboxes.It gave a rough sense of how each day played out, even if I wasn't labeling it that way while logging it.Work went into T_Work, where I logged hours worked and a productivity score (out of 10) based entirely on instinct.
Some days felt focused, others felt scattered, and I reflected that directly in the score.Conditional formatting helped those differences stand out visually without needing extra analysis.Spending lived in T_Spending, and I treated it differently from the rest.
It was more of a separate contextual layer than part of the same routine loop.Data validation drop-down categories like groceries, takeout, coffee, impulse purchases, subscriptions, and transport helped me see where money was going, and I used a separate PivotTable to break down spending by category.If you add new rows, remember to right-click the PivotTable and click Refresh to reflect those changes.
One small detail kept the whole system manageable: Excel tables automatically expand as new rows are added.That meant I never had to fix ranges or adjust formulas mid-week—structured references meant that everything scaled as I went.The dashboard turned separate logs into one picture Everything finally came together Once I started logging data, the dashboard quickly became the only part of the workbook I cared about.
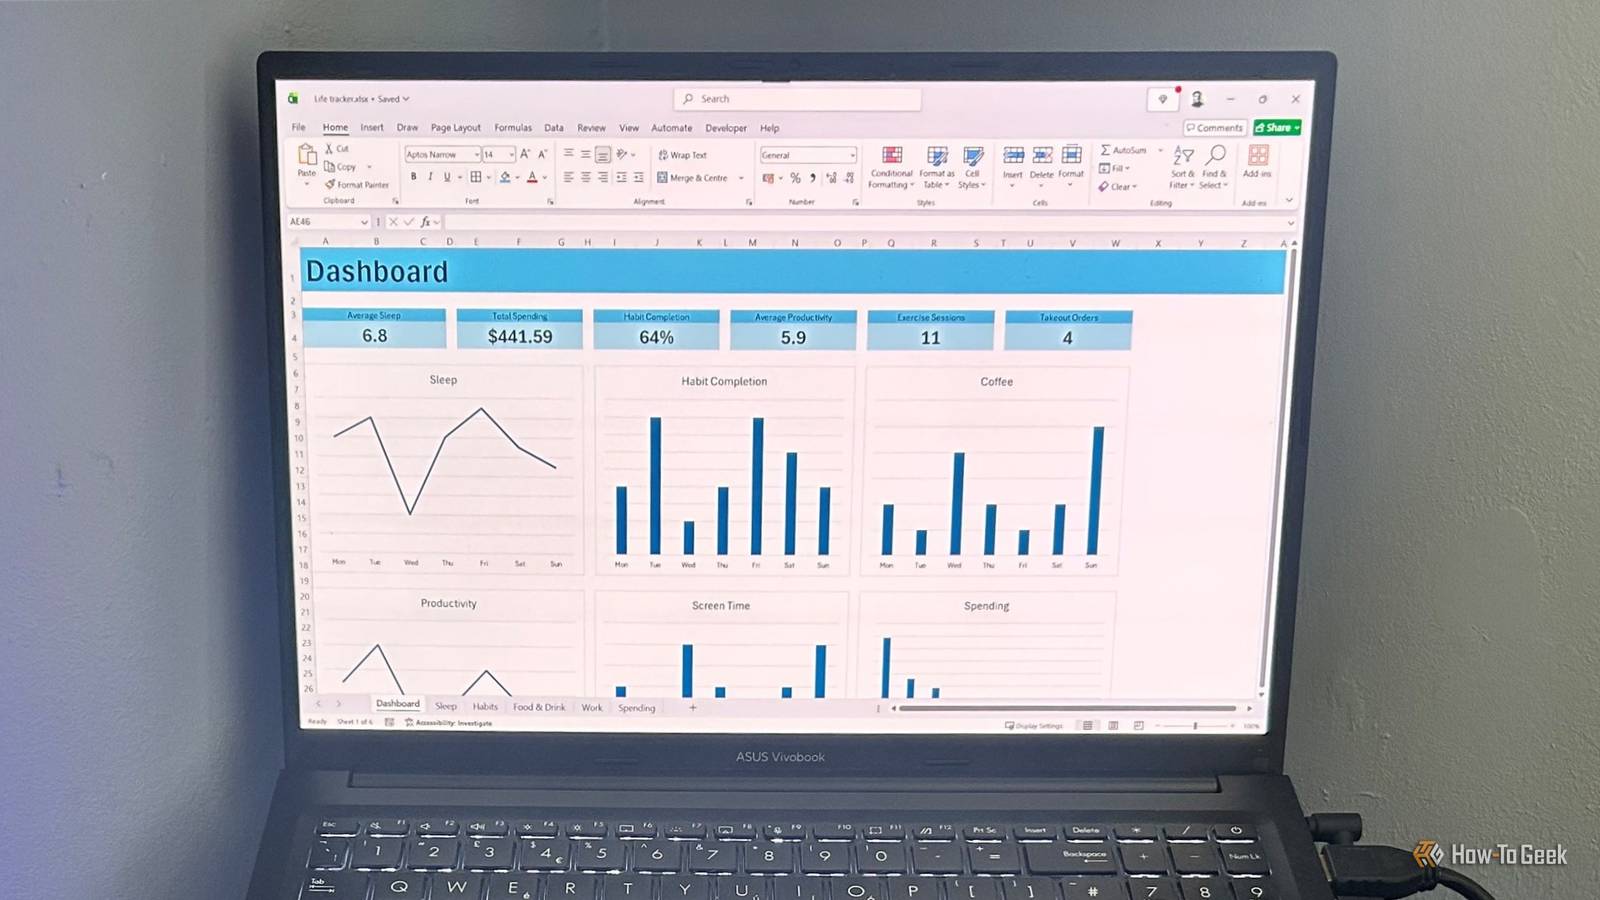
At the top, I created summary cards: Average Sleep, Total Spending, Habit Completion, Average Productivity, Exercise Sessions, and Takeout Orders.Each one pulled directly from the underlying tables and updated automatically as I logged entries.Below that, Excel charts showed how the week unfolded.
Sleep appeared as a line over time; habits, coffee consumption, and screen time moved in columns; and work productivity sat alongside as its own timeline.Finally, I used a PivotChart to visualize spending over the week.Then, I removed the Y-axis from all the charts, as the point here was to emphasize relative movement and patterns, not exact values.
Related I use these 3 Excel formulas to organize my daily life I refuse to let anyone tell me that Microsoft Excel is only for accountants.Posts 2 By Tony Phillips That's where the system started to make sense.Sleep, habits, and productivity formed the clearest loop.
When I stayed up late scrolling, I could see it the next morning in lower sleep totals, and those days tended to feel less structured overall.When I kept habits consistent—especially workouts and walks—the rest of the day followed a more stable rhythm.Spending didn't follow the same pattern as the rest, and I stopped trying to force it into one.
Instead, I noticed something else: on less structured days, takeout and impulse purchases showed up more often.Coffee tended to cluster on busier, slightly chaotic workdays, but it didn't drive anything on its own—it just appeared alongside those stretches.Individually, none of this was surprising, but seeing it layered together is what made it noticeable.
What I'll take away from a week in Excel For that week, everything lived in one workbook instead of separate apps.When I wanted the full picture, glancing at the dashboard made the connections in my routine much easier to notice.It felt like a useful reset—something I'll probably return to when things feel too scattered.
That said, it didn't replace the convenience of dedicated apps.Sleep trackers are still better at collecting data automatically, and spending apps still do a better job of capturing transactions without effort.But the experiment did change how I think about tracking in general—not as separate tools, but as one system where everything sits in the same frame.
Read More