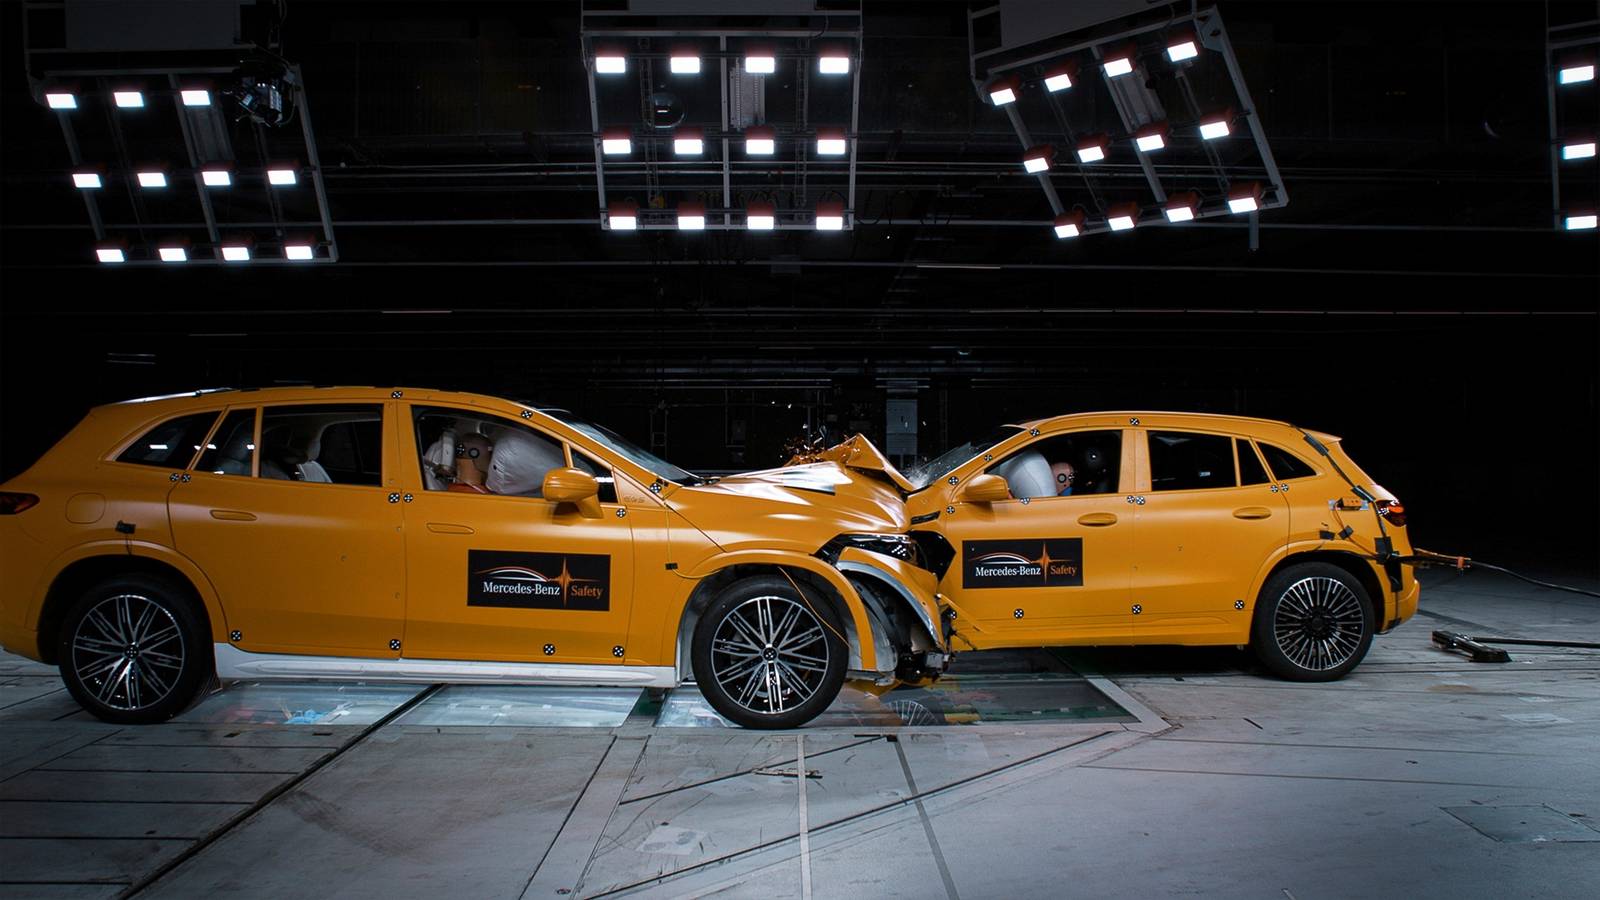
In late November 2024, an iSeeCars analysis put Tesla at the top of the country's fatal accident rankings.Tesla's rate was 5.6 deaths per billion miles driven, nearly double the industry average.iSeeCars executive analyst Karl Brauer noted that most of the vehicles topping the list have excellent crash-test ratings, attributing the elevated numbers to a mix of driver behavior and conditions rather than a flaw in the vehicles themselves.
Although Tesla topped the iSeeCars list, the brand accounted for less than 0.5% of all vehicles involved in fatal crashes in 2024.That combination, a rate double the average built on well under 1% of the crash data, means a handful of extra crashes could swing Tesla's number sharply in either direction.A separate analysis of that same 2024 crash data finds a related problem, just from the opposite end.
Omega Law Group, a personal injury law firm, cited the iSeeCars dataset in a new analysis of 2024 NHTSA crash data.Their analysis covers 56,011 vehicles involved in 36,297 fatal crashes nationwide.In the analysis by Omega Law Group, Ford, Chevrolet, and Toyota land at the top, not because they're unsafe, but because there are more of them on the road than anything else.
Popularity explains most of the rankings Adjusting for market share changes the dynamic Close Fatal crashes often involve more than one vehicle, which is why Omega Law's vehicle count runs higher than its crash count.Ranked by sheer volume, though, the results track closely with U.S.sales figures.
Rank Brand Vehicles in Fatal Crashes Share of Total 1 Ford 6,788 12.1% 2 Chevrolet 6,654 11.9% 3 Toyota 5,166 9.2% 4 Honda 4,315 7.7% 5 Nissan 2,948 5.3% Five brands account for nearly half of all vehicles involved in fatal crashes nationwide, but largely because they're the brands Americans drive the most.Ford's F-Series alone sold 765,649 units in 2024, about one truck for every 444 Americans.With that many F-Series trucks on the road, it’s much more likely to show up in these types of studies.
More trucks on the road (regardless of brand) mean more chances that one of them will be involved in a crash, but that has nothing to do with how safe the truck really is.Although Honda appears in the chart above, three of the models produced by the automaker, including the 2026 Passport and over a decade of Civic and Accord models, are listed as safe options for teenage drivers by the IIHS and Consumer Reports.Likewise, even though Nissan appears on the chart above, the Pathfinder SUV was named a Best New Vehicle for Teens by the IIHS and Consumer Reports earlier in 2026.
To separate genuine risk from popularity, Omega Law built a composite index.It weighs each brand's crash involvement against its share of new vehicle sales.Then it folds in two more factors.
One tracks how often a brand's fatal crashes involved speeding, while the other tracks how often they involved a driver at or above the legal blood alcohol limit.A score of 100 represents the national average across all measured brands.Once sales volume is factored out, the rankings look a little different.
Only nine of the 25 brands Omega Law measured score at or above the 100 average.Dodge and Infiniti are two of those nine.They score so far above the rest that they form a separate tier.
Brand Composite Score What's Driving It Dodge 223 Crash involvement far exceeds its 0.9% share of new vehicle sales.Infiniti 179 Elevated speeding (196) and DUI (131) involvement.Chrysler 118 Crash frequency relative to its sales volume.
BMW 118 High rate of speeding-related fatal crashes.Ford 92 Near average despite leading every brand in raw crash count.Toyota 84 Below average on crash frequency, speeding, and DUI rates.
Subaru 69 Lowest score of any brand measured.Ford leads every brand in crash count, yet its composite score is 92, below the national average.Toyota holds about 12.5% of the market, making it one of America's largest vehicle brands, yet it scores even lower at 84.
For Ford and Toyota, popularity and high sales volumes, not vehicle risk, are why they appear at the top of this study.Once market share is factored in, both Ford and Toyota score below the national average, meaning that just because their vehicles are recorded in more accidents does not mean they are unsafe.Dodge holds less than 1% of the new vehicle market, yet its frequency index of 439 puts its crash involvement at more than four times what its sales would predict.
Infiniti's market share is even smaller, at about 0.4%, but its overrepresentation comes from driver behavior instead.A disproportionate share of its fatal crashes involved speeding or an impaired driver, according to Omega Law's analysis.Related These are the 5 safest car brands in 2026 according to Consumer Reports From crash protection to safety technology, these brands stand out.
Posts 1 By Tyler Dupont Speeding and drunk driving cluster around a few brands Location is also a factor Close Omega Law also isolated speeding and impaired-driving crashes using 2024 NHTSA data, ranking the 10 brands with the highest share of speeding-related fatal crashes.Speeding was a factor in roughly 19% of fatal crashes nationwide, but not evenly across brands.Infiniti (36.6%), BMW (34.1%), Audi (27.9%), Tesla (25.2%), and Acura (25.1%) were five of those top 10, all posting speeding-involvement rates well above the national average.
Ford, Chevrolet, and Toyota don't appear on that list at all, despite accounting for nearly a third of all vehicles in fatal crashes.Their speeding-involvement rates simply weren't high enough to crack the top 10.Alcohol-impaired driving contributed to about 30% of all 2024 traffic deaths nationally, according to NHTSA data.
Omega Law found DUI involvement wasn't evenly distributed either.Infiniti (38.2%), Mercedes-Benz (37.4%), Tesla (35%), Audi (34%), and BMW (33.6%) all posted DUI-involvement rates well above that.Six of the eight brands topping the speeding list also topped the DUI list, suggesting the kind of driver each brand attracts is a factor when it comes to traffic accident data.
The luxury-brand tilt doesn't hold for distracted driving, though.Those fatalities skewed toward mainstream trucks and SUVs instead, led by Pontiac, Ram, GMC, and Jeep, while Kia, Hyundai, Ford, Chevrolet, and Toyota all landed close to the national average across all three categories.iSeeCars also mapped fatal-crash rates for model-year 2018 to 2022 vehicles across the 50 largest U.S.
metro areas.The Kia Forte posted the highest rate of any vehicle in seven of those metros, more than any other model, while the Ram 1500 led in four metros and the Nissan Frontier led three.The Forte's local rate ranged from 5.9 fatal crashes per billion miles in the Cleveland-Akron-Canton area to 13.8 in Jacksonville, Florida.
A total of 36 different vehicles led the rankings in at least one U.S.metro, reflecting differences in commute patterns, average speeds, and miles driven by region, not just the vehicle.Omega Law notes the findings are correlational, since the study didn't control for driver demographics or local road conditions.
In other words, a high local crash rate isn't proof a specific make and model is dangerous in that city or town.How to interpret the next "most dangerous vehicle" list The next time a headline names a “most dangerous vehicle,” a few questions can cut through the confusion.Is the number a raw count, or is it adjusted for how many of that vehicle type are on the road? Is the risk coming from the vehicle itself, or from how it tends to be driven? What does the national average look like when compared to the local data, and so on? In this particular analysis from Omega Law Group, Ford, Chevy, Toyota, and Honda are simply common vehicles, not dangerous ones.
Even the sharpest localized figures, like the Kia Forte in Jacksonville, remain correlational rather than proof about that specific model.
Read More