Early on, when I had just started getting into homelabbing and self-hosting, my initial assumption was that once I configured a service properly, and got it up and running, it would just stay that way indefinitely.As I set up more and more services, my mini homelab grew to include a couple of servers and VPS instances.It started getting out of hand a bit.
I started experiencing my first service outages.Apparently, a homelab requires maintenance.I spent a lot of time setting up things like reverse proxies, cron jobs, custom scripts, web servers, and VPS firewall configurations.
Even after all that work, days or weeks later, some of those services would just randomly go down.By then, I had completely forgotten how I set stuff up in the first place, and it was just a whole mess.So I started using some Docker services to monitor my little homelab network and diagnose things.
Uptime Kuma Monitor the uptime and get notified when stuff break You might have come across those status trackers online which tell you when a site is down.They usually have some kind of visual indicators or dynamic graphs to track a site's uptime and outages.Uptime Kuma does the same thing, except you can point at your self-hosted services.
Related 3 Self-Hosted Services I'm Running in My Homelab and Use Every Day Plus, which ones I'm looking to try next.Posts 6 By Jordan Gloor To set up Uptime Kuma, you create what's called a "monitor" for a service and the monitor shows you stats like current and average response times, as well as uptime percentages.When setting up the monitor, you point it at the URL you use to access the service and set a "heartbeat" timer.
Uptime Kuma periodically pings the URL address and logs the time-stamped results.By default, that heartbeat interval is 60 seconds, but you can set it to whatever you want.It shows those logs as green uptime and red downtime indicators.
You can also see the same logs in greater detail as interactive graphs.If you give Uptime Kuma a try, you should also set up notification alerts.Basically, if any of the services being monitored go down, Uptime Kuma will send you an alert.
You can choose from a whole list of notification providers, including Discord, Telegram, Email, Signal, and Ntfy.I already use Ntfy to push notifications to my phone, so I use Ntfy alerts for Uptime Kuma too.The idea is that the time-stamped logs, the response time stats, and SSL expiration help you rule out the usual suspects when you inevitably hit that "Problem loading page" error.
Netshoot All the tools you need for network diagnostics in one container When a service goes down or misbehaves, the next step is to figure out what's wrong.You might have noticed that a typical Docker compose file has a "network" flag.It defines a virtual network for that container.
Docker containers usually don't use the host network directly.So if you want to figure out what's wrong with that virtual network, you can't do so directly from the host.That's what Netshoot is for.
You can list virtual Docker networks with this command.docker network ls You can run Netshoot as a temporary Docker container that lets you interact with any of the Docker networks on your list.Substitute bridge with your target network.
The --rm -it flags tell Docker to remove this container when you exit it and give you an interactive shell.docker run --rm -it --network bridge nicolaka/netshoot To target a particular container, run this command.docker run --rm -it --network container: nicolaka/netshoot It should open an interactive Netshoot shell, which gives you access to 70+ networking tools.
Some of them include basic networking commands like ping, curl, nmap, traceroute, netstat, tcpdump, iperf3.For example, ping can test if a host is reachable.With netstat, you can find if a port is already occupied.
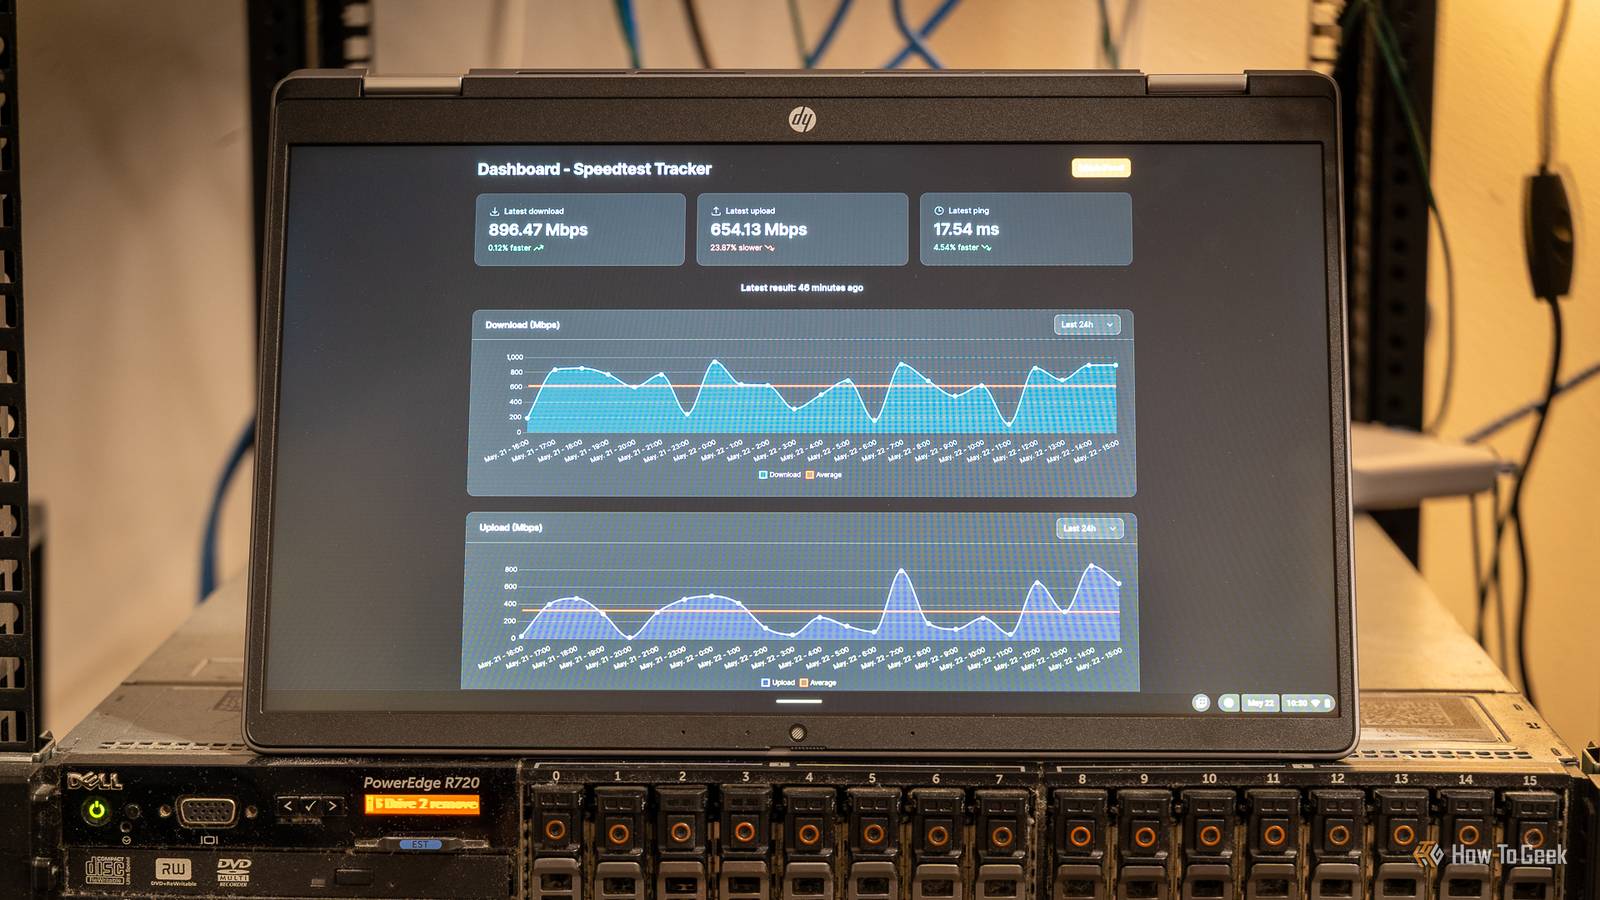
This has happened to me more than once.Since I'm running multiple web servers and Docker containers on my VPS instances, port conflicts are a recurring headache.OpenSpeedTest Speed tests for your homelab Usually when you run an internet speed test on a website like Ookla, it tests your internet connection with an Ookla server.
However, if you want to test the connection between a client (like your phone or laptop) and your home server, you'll want to run a speed test that targets that network.That's exactly what OpenSpeedTest does.It lets you test connection speeds of different nodes on your homelab network.
You can spin up a Docker container for OpenSpeedTest.By default, it maps to port 3001 for HTTPS, which should work fine for most people.However, Uptime Kuma also defaults to that port, so watch out for that if you have Uptime Kuma running already.
Subscribe to the newsletter for practical homelab tools Get hands-on homelab guidance: subscribe to the newsletter for actionable diagnostics, Docker tool walkthroughs, and practical tips—Uptime Kuma, Netshoot, OpenSpeedTest and more—so you can keep self-hosted services stable and manageable.Get Updates By subscribing, you agree to receive newsletter and marketing emails, and accept our Terms of Use and Privacy Policy.You can unsubscribe anytime.
The web UI looks the same as any regular internet speed test.It checks the upload and download speeds in megabits, as well as the latency and jitter (how stable or consistent the connection is).Raspberry Pi 5 Brand Raspberry Pi Storage 8GB CPU Cortex A7 Memory 8GB $80 at Spark Fun $93 at Amazon $80 at CanaKit Expand Collapse These Docker containers make diagnostics a little bit more manageable As opposed to installing diagnostics tools on bare metal, it's better to spin up these containers in a homelab environment because they can be completely wiped off the server once you're done.
I'd recommend keeping Uptime Kuma though, if your server can spare the resources.
Read More